30
/
AIzaSyAYiBZKx7MnpbEhh9jyipgxe19OcubqV5w
April 1, 2024
222386
Peru
PER
true
2
1
Investment in transport with private participation (current US$)
2016,2015,2014,2013,2012,2011,2010,2009,2008,2007,2006,2005,2004,2002,2000,1999,1995
Public Timelines
FAQ
Menu
Public Timelines
FAQ
Public Timelines
FAQ
For education
For educational institutions
For teachers
For students
Open cabinet
For educational institutions
For teachers
For students
Open cabinet
Create
Close
Create a timeline
Public timelines
Library
FAQ
Download
Global statistics library
→
Peru
→
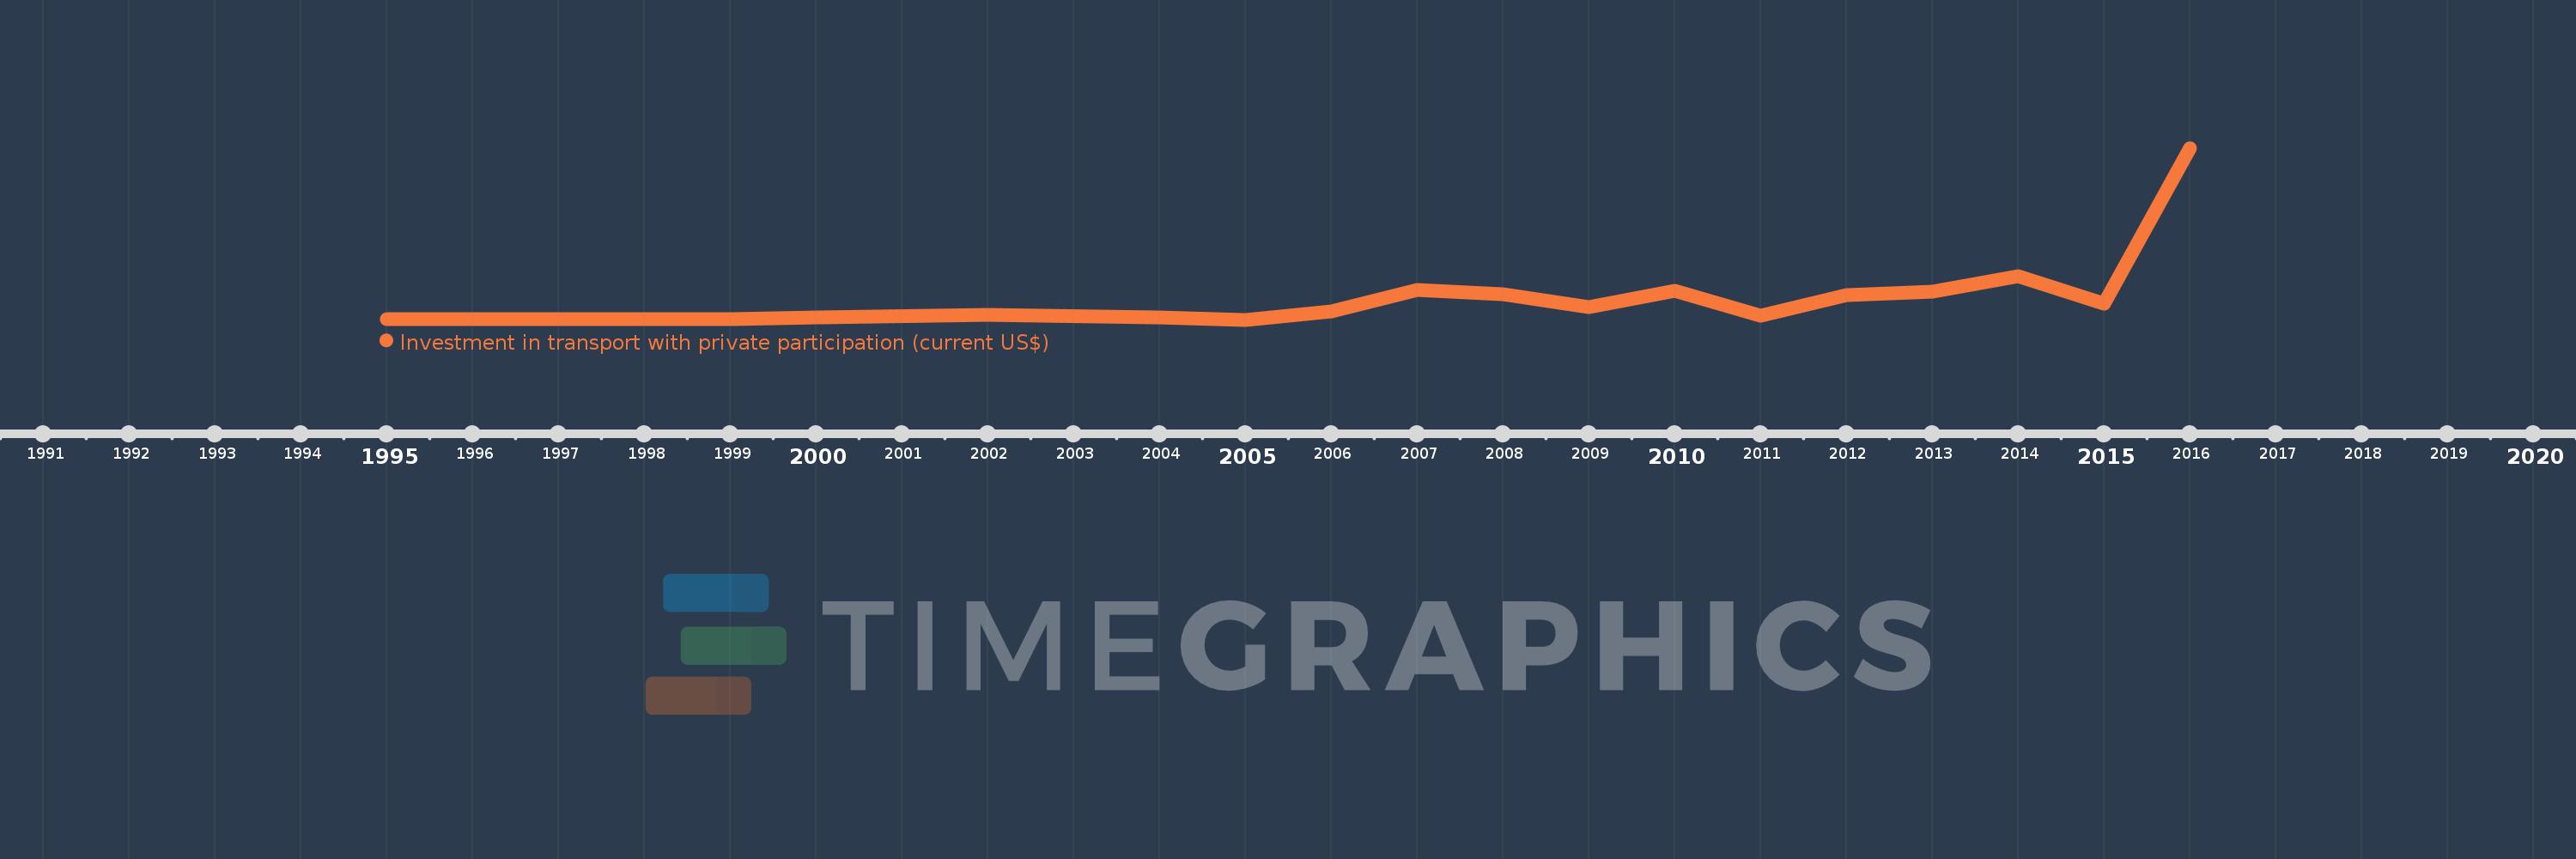
Investment in transport with private participation (current US$)
This statistics in other country:
Albania
Algeria
Angola
Argentina
Armenia
Bangladesh
Belarus
Belize
Benin
Bolivia
Brazil
Bulgaria
Burkina Faso
Cambodia
Cameroon
Chile
China
Colombia
Comoros
Congo, Dem. Rep.
Congo, Rep.
Costa Rica
Cote d'Ivoire
Cuba
Djibouti
Dominican Republic
Early-demographic dividend
East Asia & Pacific (excluding high income)
East Asia & Pacific (IDA & IBRD countries)
Ecuador
Egypt, Arab Rep.
Gabon
Georgia
Ghana
Guatemala
Guinea
Haiti
Honduras
IBRD only
IDA & IBRD total
IDA blend
India
Indonesia
Iraq
Jamaica
Jordan
Kazakhstan
Kenya
Kosovo
Lao PDR
Late-demographic dividend
Latin America & Caribbean
Latin America & Caribbean (excluding high income)
Latin America & the Caribbean (IDA & IBRD countries)
Lebanon
Liberia
Low & middle income
Lower middle income
Macedonia, FYR
Madagascar
Malawi
Malaysia
Maldives
Mali
Mauritius
Mexico
Middle income
Moldova
Montenegro
Morocco
Mozambique
Myanmar
Nepal
Nicaragua
Nigeria
Pakistan
Panama
Paraguay
Peru
Philippines
Romania
Russian Federation
Senegal
Sierra Leone
Somalia
South Africa
South Asia
South Asia (IDA & IBRD)
Sri Lanka
Sudan
Syrian Arab Republic
Tanzania
Thailand
Togo
Tunisia
Turkey
Uganda
Ukraine
Upper middle income
Uruguay
Uzbekistan
Venezuela, RB
Vietnam
Yemen, Rep.
Zambia
Zimbabwe
Timeline:
This timeline shows a graph from
1995
to
2016
of Peru. No data until
1994
. Number of actual observations by date:
17
.
Source name:
World Development Indicators
Source organization:
World Bank, Private Participation in Infrastructure Project Database (http://ppi.worldbank.org).
Categories, topics:
Infrastructure, Private Sector
Last updated:
apr 23, 2017
Indicators value changes by year
Meaning:
817.884 mln
Minimum:
0.0
jan 1, 2005
Maximum:
5.925 bln
jan 1, 2016
At the date of observation
Value
Absolute change
Change from the previous value
jan 1, 1995
6.6 mln
+6.6 mln
0.0%
jan 1, 1999
8.0 mln
+1.4 mln
21.21%
jan 1, 2000
78.3 mln
+70.3 mln
878.75%
jan 1, 2002
164.5 mln
+86.2 mln
110.09%
jan 1, 2004
75.0 mln
-89.5 mln
-54.41%
jan 1, 2005
0.0
-75.0 mln
-100.0%
jan 1, 2006
283.0 mln
+283.0 mln
%
jan 1, 2007
1.02 bln
+737.0 mln
260.42%
jan 1, 2008
875.8 mln
-144.2 mln
-14.14%
jan 1, 2009
439.0 mln
-436.8 mln
-49.87%
jan 1, 2010
987.83 mln
+548.83 mln
125.02%
jan 1, 2011
127.0 mln
-860.83 mln
-87.14%
jan 1, 2012
860.0 mln
+733.0 mln
577.17%
jan 1, 2013
983.0 mln
+123.0 mln
14.3%
jan 1, 2014
1.506 bln
+523.0 mln
53.2%
jan 1, 2015
565.0 mln
-941.0 mln
-62.48%
jan 1, 2016
5.925 bln
+5.36 bln
948.67%
Ranking of countries by current statistics by years
About & Feedback
Terms
Privacy
Library
2024
©
Time.Graphics
Support 24/7
Cabinet
Get premium
Donate
The service accepts bank transfer (ACH, Wire) or cards (Visa, MasterCard, etc). Processed by Stripe.
Secured with SSL
Excellent (Trustpilot Reviews)
Based on 115+ reviews
Write your own review on
Trustpilot.com
