Download This statistics in other country:
Timeline:
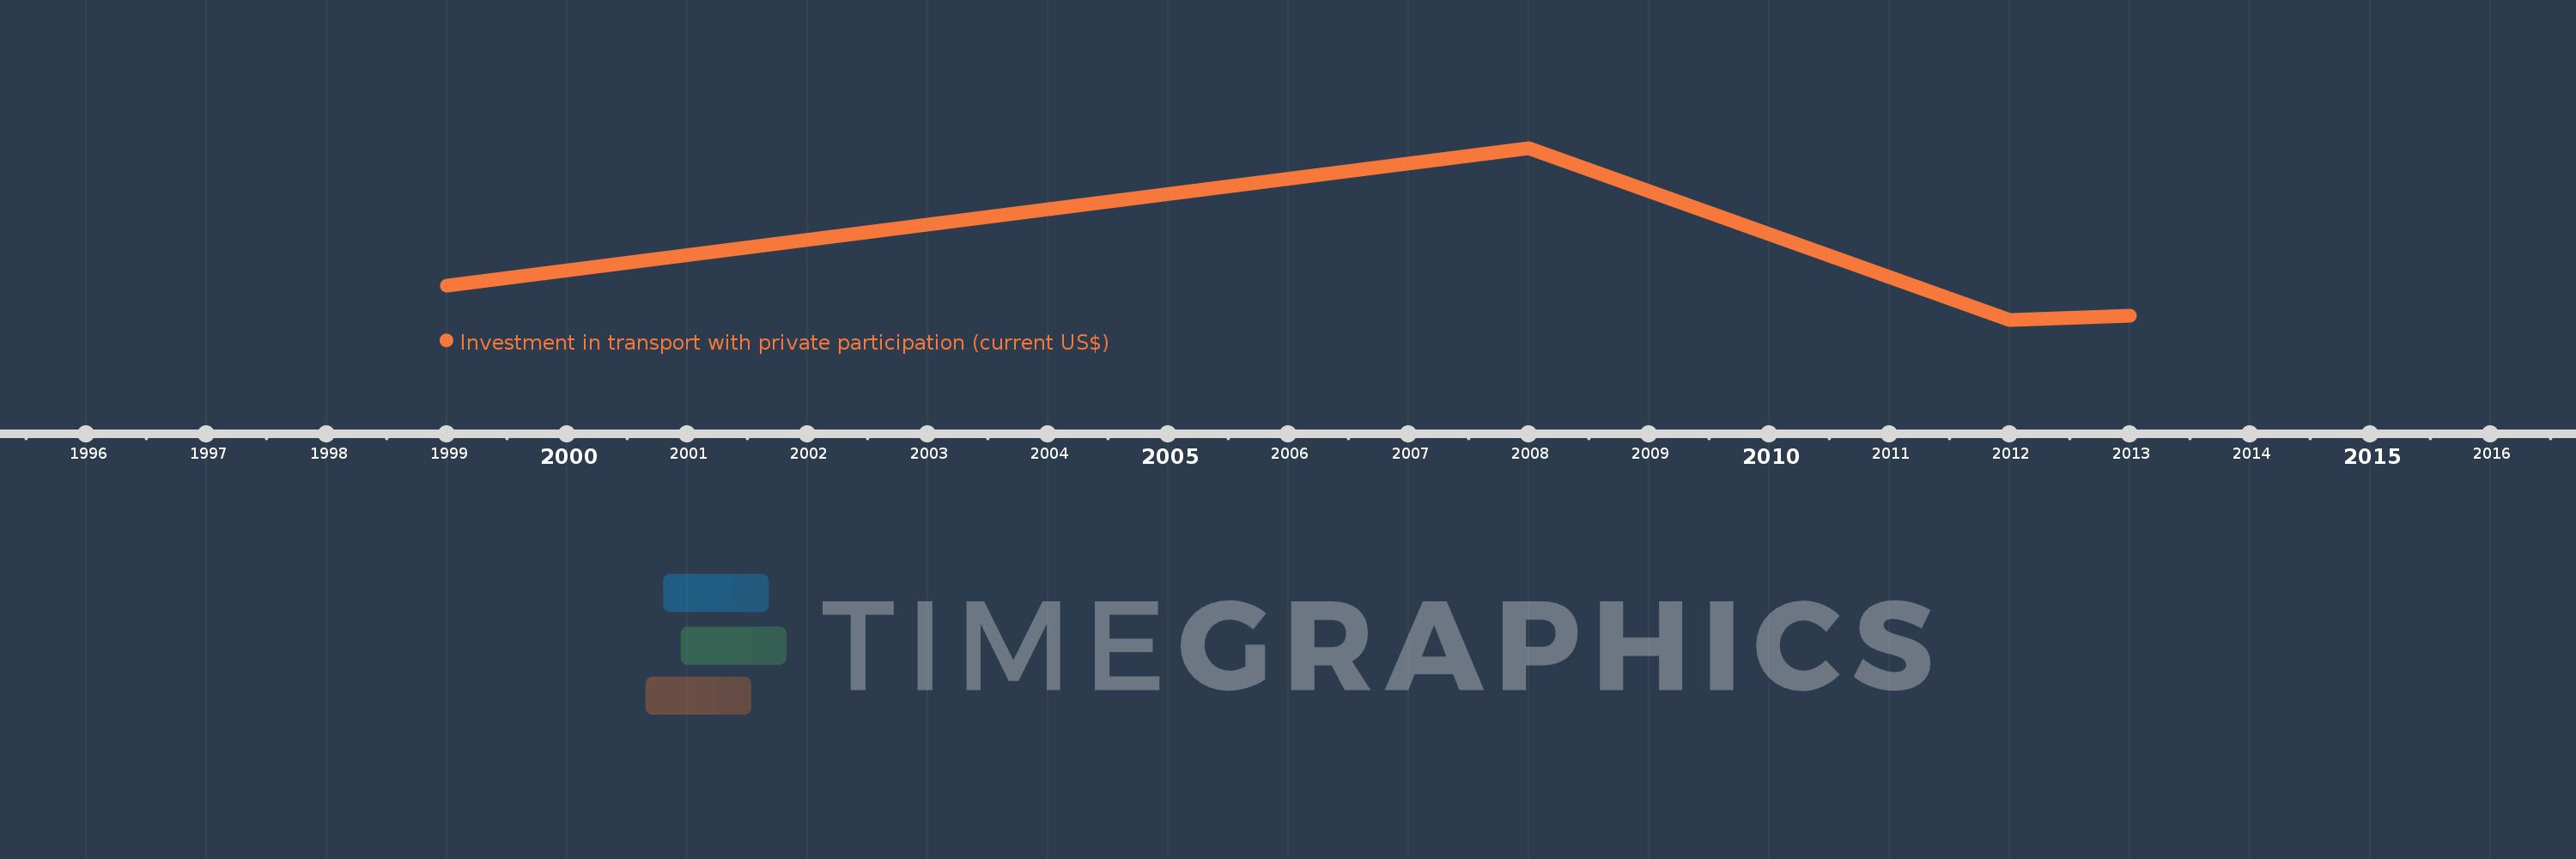
This timeline shows a graph from 1999 to 2013 of Romania. No data until 1998. Number of actual observations by date: 4.
Source name:
World Development Indicators
Source organization:
World Bank, Private Participation in Infrastructure Project Database (http://ppi.worldbank.org).
Categories, topics:
Infrastructure, Private Sector
Last updated:
apr 23, 2017
Indicators value changes by year
Maximum:
116.8 mln
jan 1, 2008
At the date of observation
Value
Absolute change
Change from the previous value
jan 1, 1999
23.4 mln
+23.4 mln
0.0%
jan 1, 2008
116.8 mln
+93.4 mln
399.15%
jan 1, 2012
0.0
-116.8 mln
-100.0%
jan 1, 2013
2.5 mln
+2.5 mln
%
Ranking of countries by current statistics by years
