29
/
en
AIzaSyAYiBZKx7MnpbEhh9jyipgxe19OcubqV5w
April 1, 2024
42745
Latin America & Caribbean (excluding high income)
LAC
false
2
1
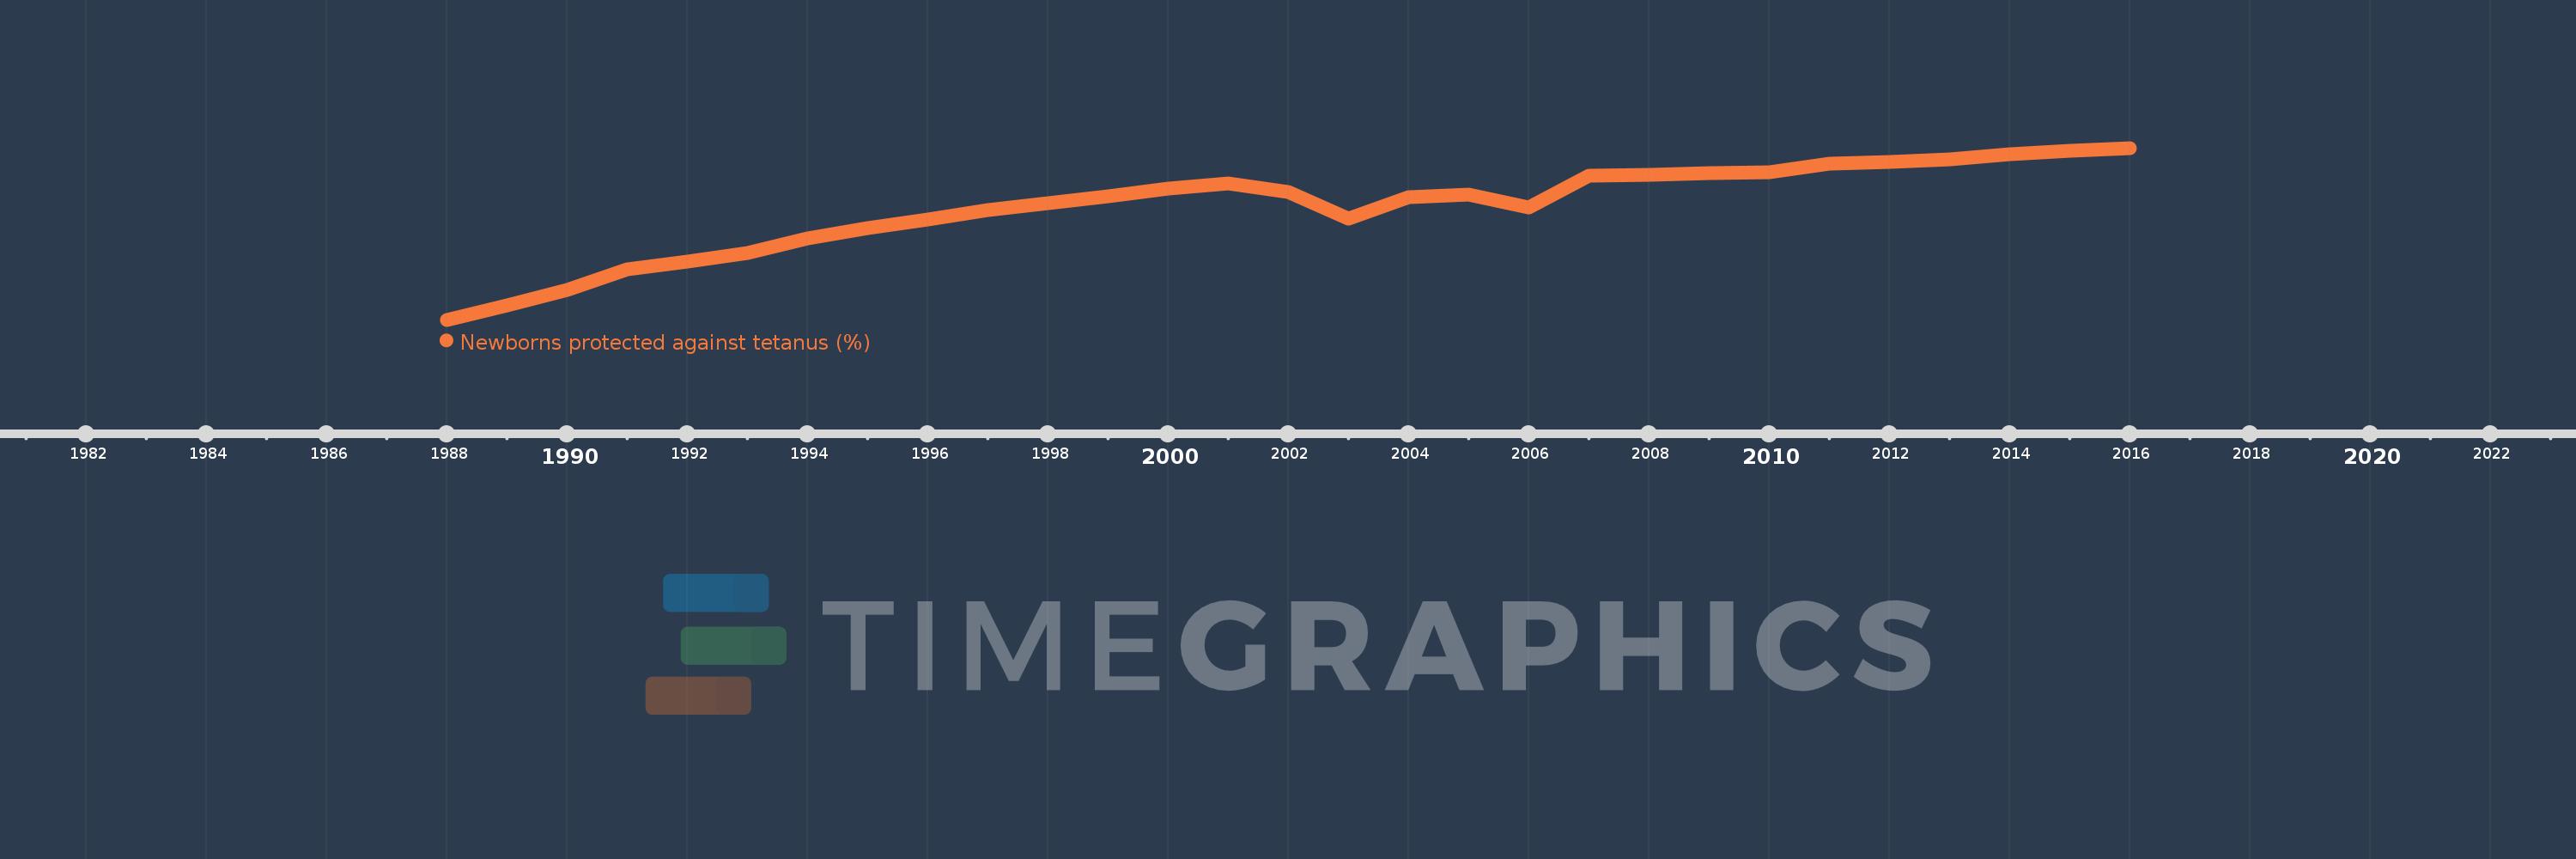
Newborns protected against tetanus (%)
2016,2015,2014,2013,2012,2011,2010,2009,2008,2007,2006,2005,2004,2003,2002,2001,2000,1999,1998,1997,1996,1995,1994,1993,1992,1991,1990,1989,1988
This statistics in other country:
Timeline:
This timeline shows a graph from 1988 to 2016 of Latin America & Caribbean (excluding high income). No data until 1987. Number of actual observations by date: 29.
Source name:
World Development Indicators
Source organization:
WHO and UNICEF (http://www.who.int/immunization/monitoring_surveillance/en/).
Categories, topics:
Health
Last updated:
apr 23, 2017
Indicators value changes by year
Minimum:
40.737
jan 1, 1988
Maximum:
88.732
jan 1, 2016
At the date of observation
Value
Absolute change
Change from previous value
jan 1, 1988
40.737
+40.737
0.0%
jan 1, 1989
44.759
+4.022
9.87%
jan 1, 1990
49.13
+4.371
9.76%
jan 1, 1991
54.745
+5.615
11.43%
jan 1, 1992
56.906
+2.161
3.95%
jan 1, 1993
59.317
+2.411
4.24%
jan 1, 1994
63.448
+4.131
6.96%
jan 1, 1995
66.324
+2.876
4.53%
jan 1, 1996
68.862
+2.537
3.83%
jan 1, 1997
71.277
+2.415
3.51%
jan 1, 1998
73.291
+2.014
2.83%
jan 1, 1999
75.132
+1.841
2.51%
jan 1, 2000
77.34
+2.208
2.94%
jan 1, 2001
78.852
+1.512
1.95%
jan 1, 2002
76.335
-2.516
-3.19%
jan 1, 2003
68.907
-7.428
-9.73%
jan 1, 2004
74.932
+6.025
8.74%
jan 1, 2005
75.709
+0.776
1.04%
jan 1, 2006
72.006
-3.702
-4.89%
jan 1, 2007
80.997
+8.991
12.49%
jan 1, 2008
81.325
+0.328
0.4%
jan 1, 2009
81.652
+0.327
0.4%
jan 1, 2010
82.04
+0.388
0.48%
jan 1, 2011
84.438
+2.398
2.92%
jan 1, 2012
84.868
+0.43
0.51%
jan 1, 2013
85.423
+0.555
0.65%
jan 1, 2014
86.997
+1.574
1.84%
jan 1, 2015
87.904
+0.907
1.04%
jan 1, 2016
88.732
+0.828
0.94%
Ranking of countries by current statistics by years


Comments: