29
/
en
AIzaSyAYiBZKx7MnpbEhh9jyipgxe19OcubqV5w
April 1, 2024
204468
Myanmar
MMR
true
2
1
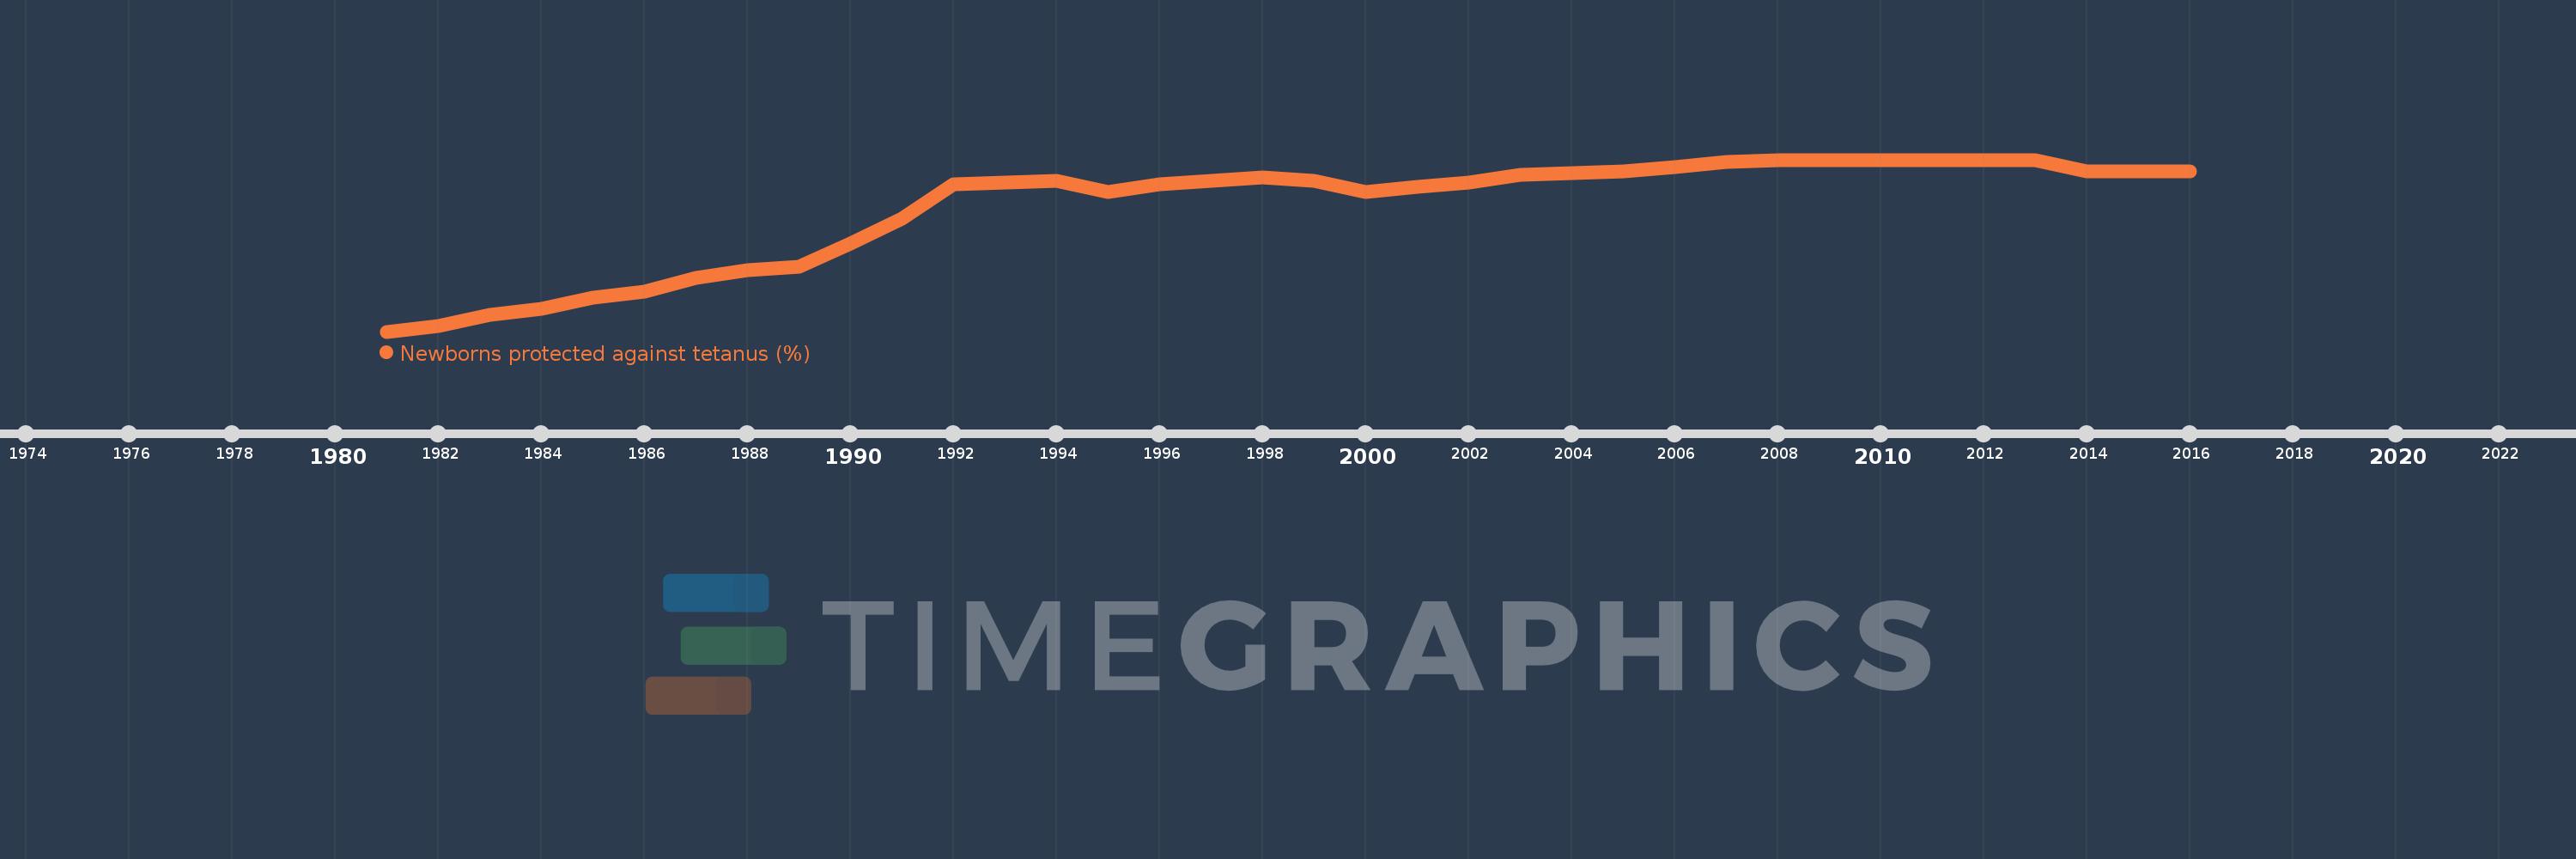
Newborns protected against tetanus (%)
2016,2015,2014,2013,2012,2011,2010,2009,2008,2007,2006,2005,2004,2003,2002,2001,2000,1999,1998,1997,1996,1995,1994,1993,1992,1991,1990,1989,1988,1987,1986,1985,1984,1983,1982,1981
This statistics in other country:
Timeline:
This timeline shows a graph from 1981 to 2016 of Myanmar. No data until 1980. Number of actual observations by date: 36.
Source name:
World Development Indicators
Source organization:
WHO and UNICEF (http://www.who.int/immunization/monitoring_surveillance/en/).
Categories, topics:
Health
Last updated:
apr 23, 2017
Indicators value changes by year
At the date of observation
Value
Absolute change
Change from previous value
jan 1, 1982
6.0
+3.0
100.0%
jan 1, 1983
12.0
+6.0
100.0%
jan 1, 1984
15.0
+3.0
25.0%
jan 1, 1985
21.0
+6.0
40.0%
jan 1, 1986
24.0
+3.0
14.29%
jan 1, 1987
31.0
+7.0
29.17%
jan 1, 1988
35.0
+4.0
12.9%
jan 1, 1989
37.0
+2.0
5.71%
jan 1, 1990
49.0
+12.0
32.43%
jan 1, 1991
62.0
+13.0
26.53%
jan 1, 1992
80.0
+18.0
29.03%
jan 1, 1993
81.0
+1.0
1.25%
jan 1, 1994
82.0
+1.0
1.23%
jan 1, 1995
76.0
-6.0
-7.32%
jan 1, 1996
80.0
+4.0
5.26%
jan 1, 1997
82.0
+2.0
2.5%
jan 1, 1998
84.0
+2.0
2.44%
jan 1, 1999
82.0
-2.0
-2.38%
jan 1, 2000
76.0
-6.0
-7.32%
jan 1, 2001
79.0
+3.0
3.95%
jan 1, 2002
81.0
+2.0
2.53%
jan 1, 2003
85.0
+4.0
4.94%
jan 1, 2004
86.0
+1.0
1.18%
jan 1, 2005
87.0
+1.0
1.16%
jan 1, 2006
89.0
+2.0
2.3%
jan 1, 2007
92.0
+3.0
3.37%
jan 1, 2008
93.0
+1.0
1.09%
jan 1, 2014
87.0
-6.0
-6.45%
Ranking of countries by current statistics by years


Comments: