29
/
en
AIzaSyAYiBZKx7MnpbEhh9jyipgxe19OcubqV5w
April 1, 2024
246025
South Africa
ZAF
true
2
1
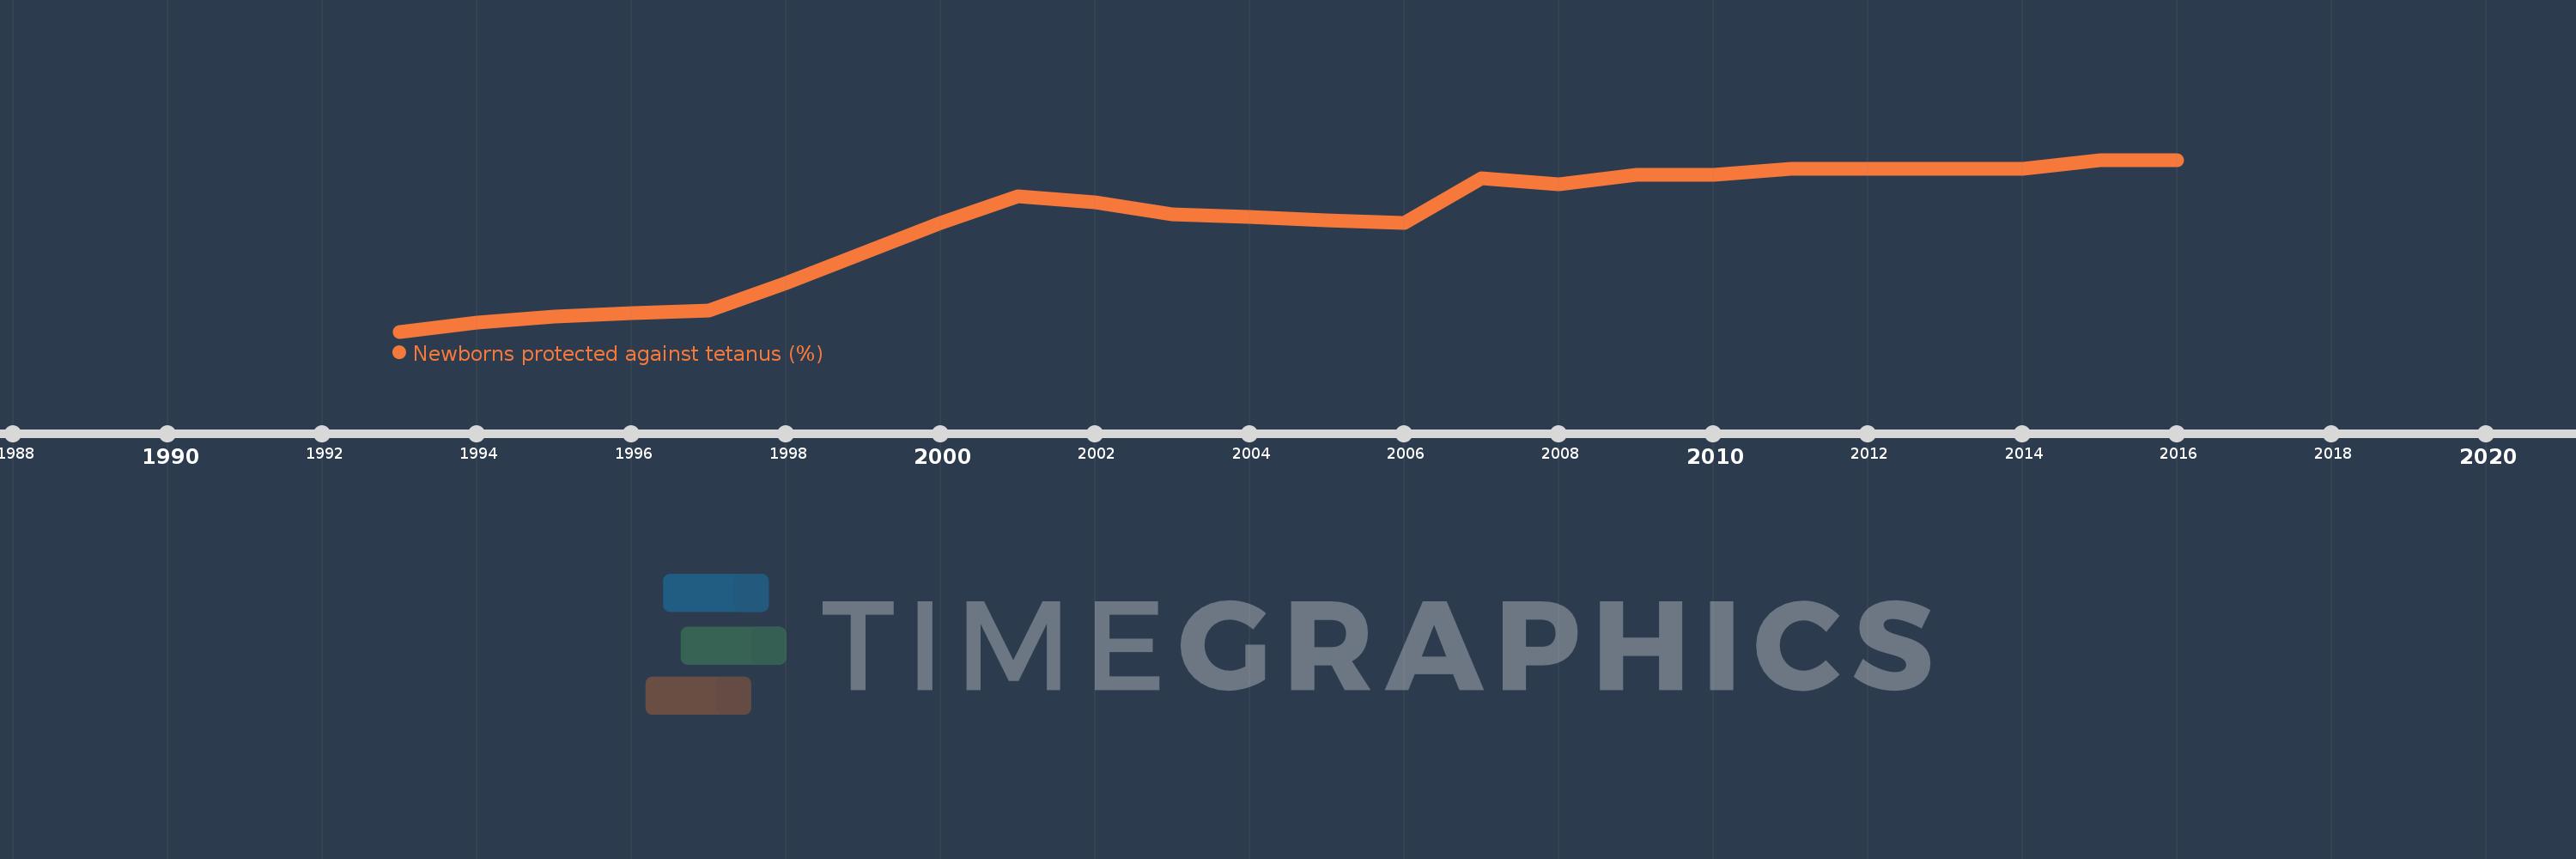
Newborns protected against tetanus (%)
2016,2015,2014,2013,2012,2011,2010,2009,2008,2007,2006,2005,2004,2003,2002,2001,2000,1999,1998,1997,1996,1995,1994,1993
This statistics in other country:
Timeline:
This timeline shows a graph from 1993 to 2016 of South Africa. No data until 1992. Number of actual observations by date: 24.
Source name:
World Development Indicators
Source organization:
WHO and UNICEF (http://www.who.int/immunization/monitoring_surveillance/en/).
Categories, topics:
Health
Last updated:
apr 23, 2017
Indicators value changes by year
At the date of observation
Value
Absolute change
Change from previous value
jan 1, 1993
23.0
+23.0
0.0%
jan 1, 1994
26.0
+3.0
13.04%
jan 1, 1995
28.0
+2.0
7.69%
jan 1, 1996
29.0
+1.0
3.57%
jan 1, 1997
30.0
+1.0
3.45%
jan 1, 1998
39.0
+9.0
30.0%
jan 1, 1999
49.0
+10.0
25.64%
jan 1, 2000
59.0
+10.0
20.41%
jan 1, 2001
68.0
+9.0
15.25%
jan 1, 2002
66.0
-2.0
-2.94%
jan 1, 2003
62.0
-4.0
-6.06%
jan 1, 2004
61.0
-1.0
-1.61%
jan 1, 2005
60.0
-1.0
-1.64%
jan 1, 2006
59.0
-1.0
-1.67%
jan 1, 2007
74.0
+15.0
25.42%
jan 1, 2008
72.0
-2.0
-2.7%
jan 1, 2009
75.0
+3.0
4.17%
jan 1, 2011
77.0
+2.0
2.67%
jan 1, 2015
80.0
+3.0
3.9%
Ranking of countries by current statistics by years


Comments: