29
/
en
AIzaSyAYiBZKx7MnpbEhh9jyipgxe19OcubqV5w
April 1, 2024
34482
Fragile and conflict affected situations
FCS
false
2
1
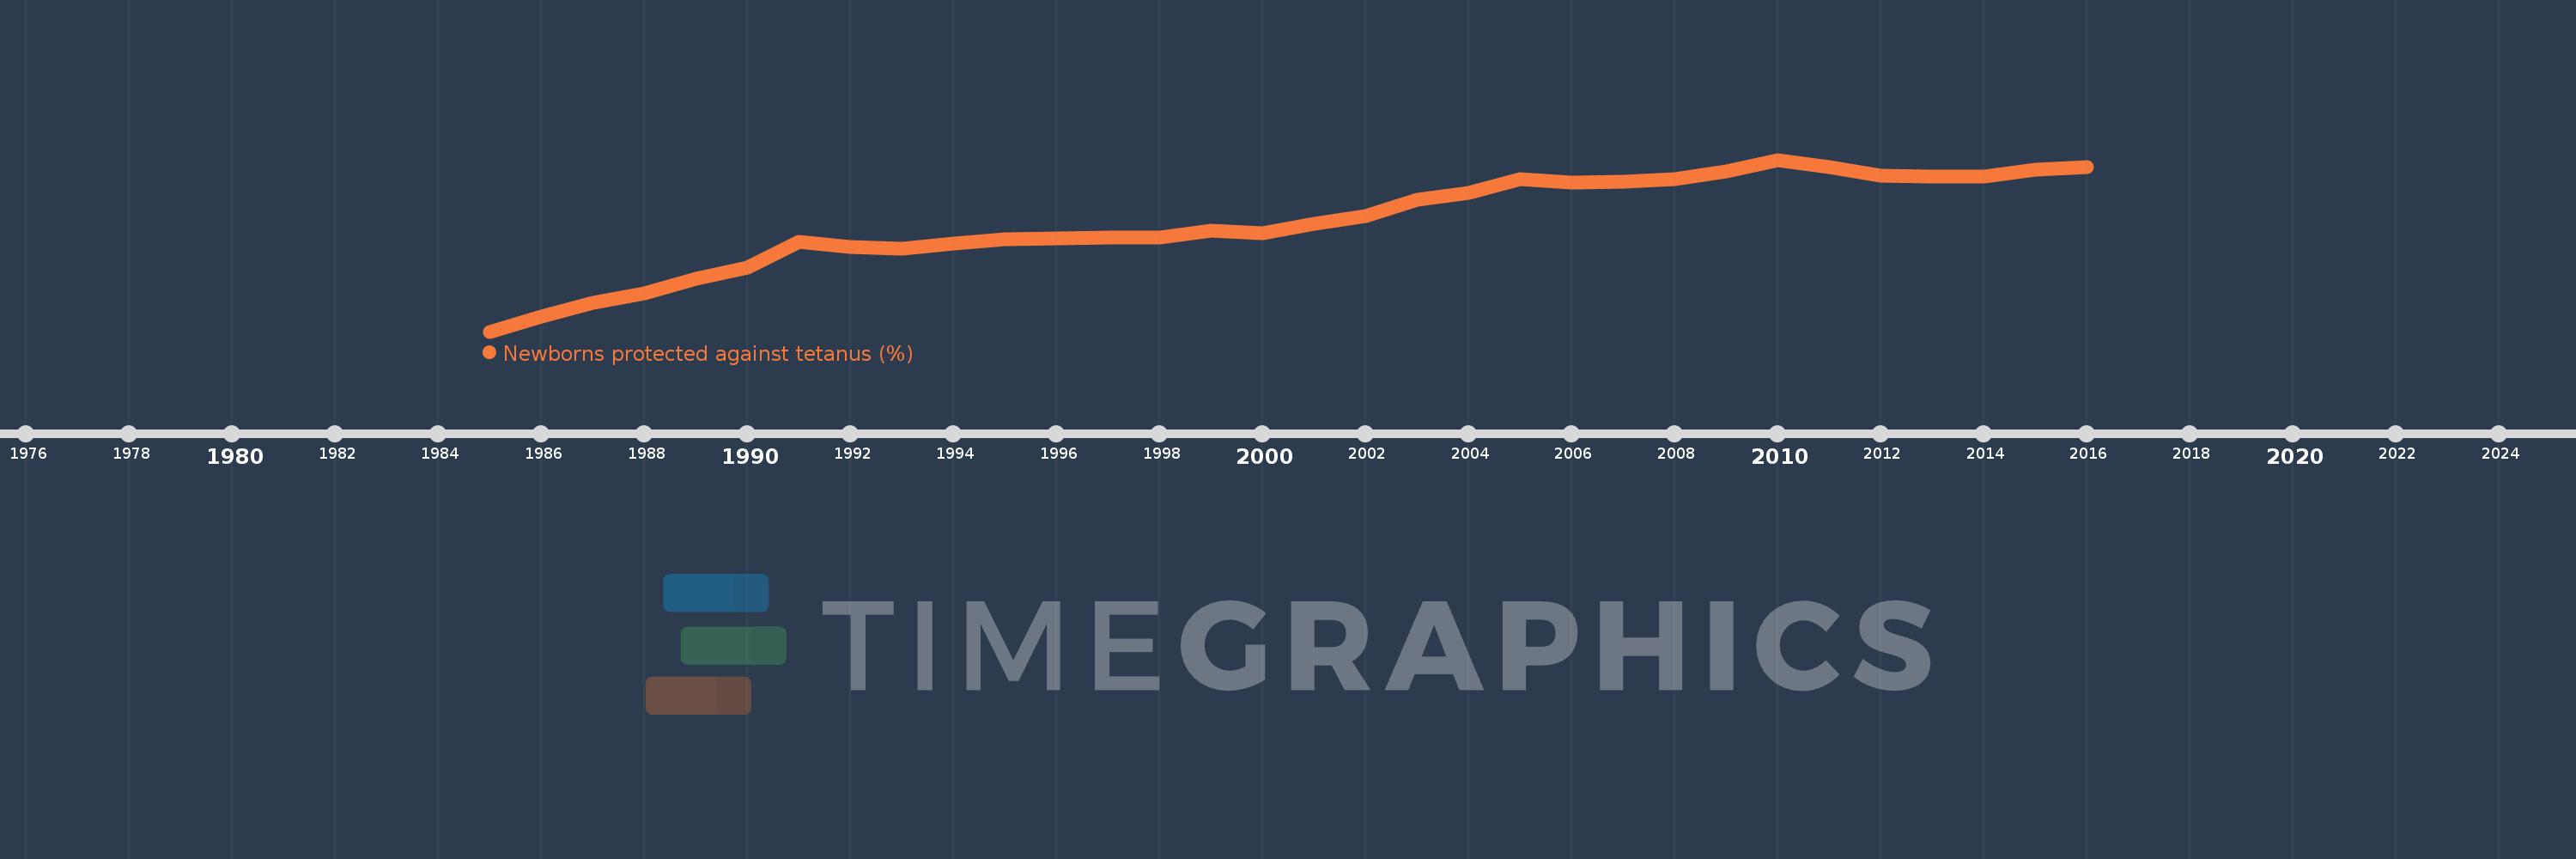
Newborns protected against tetanus (%)
2016,2015,2014,2013,2012,2011,2010,2009,2008,2007,2006,2005,2004,2003,2002,2001,2000,1999,1998,1997,1996,1995,1994,1993,1992,1991,1990,1989,1988,1987,1986,1985
This statistics in other country:
Timeline:
This timeline shows a graph from 1985 to 2016 of Fragile and conflict affected situations. No data until 1984. Number of actual observations by date: 32.
Source name:
World Development Indicators
Source organization:
WHO and UNICEF (http://www.who.int/immunization/monitoring_surveillance/en/).
Categories, topics:
Health
Last updated:
apr 23, 2017
Indicators value changes by year
Minimum:
16.922
jan 1, 1985
Maximum:
81.189
jan 1, 2010
At the date of observation
Value
Absolute change
Change from previous value
jan 1, 1985
16.922
+16.922
0.0%
jan 1, 1986
22.449
+5.526
32.66%
jan 1, 1987
27.675
+5.226
23.28%
jan 1, 1988
31.14
+3.466
12.52%
jan 1, 1989
36.701
+5.561
17.86%
jan 1, 1990
40.824
+4.124
11.24%
jan 1, 1991
50.652
+9.828
24.07%
jan 1, 1992
48.698
-1.954
-3.86%
jan 1, 1993
48.064
-0.635
-1.3%
jan 1, 1994
50.005
+1.941
4.04%
jan 1, 1995
51.571
+1.566
3.13%
jan 1, 1996
51.857
+0.286
0.55%
jan 1, 1997
52.164
+0.307
0.59%
jan 1, 1998
52.205
+0.041
0.08%
jan 1, 1999
54.666
+2.462
4.72%
jan 1, 2000
53.709
-0.957
-1.75%
jan 1, 2001
57.226
+3.517
6.55%
jan 1, 2002
60.236
+3.01
5.26%
jan 1, 2003
66.112
+5.876
9.76%
jan 1, 2004
68.865
+2.753
4.16%
jan 1, 2005
73.915
+5.05
7.33%
jan 1, 2006
72.523
-1.392
-1.88%
jan 1, 2007
73.154
+0.631
0.87%
jan 1, 2008
73.906
+0.752
1.03%
jan 1, 2009
76.933
+3.027
4.1%
jan 1, 2010
81.189
+4.256
5.53%
jan 1, 2011
78.584
-2.605
-3.21%
jan 1, 2012
75.254
-3.329
-4.24%
jan 1, 2013
74.831
-0.424
-0.56%
jan 1, 2014
74.874
+0.043
0.06%
jan 1, 2015
77.405
+2.531
3.38%
jan 1, 2016
78.565
+1.16
1.5%
Ranking of countries by current statistics by years


Comments: