29
/
en
AIzaSyAYiBZKx7MnpbEhh9jyipgxe19OcubqV5w
April 1, 2024
37650
IDA & IBRD total
IBT
false
2
1
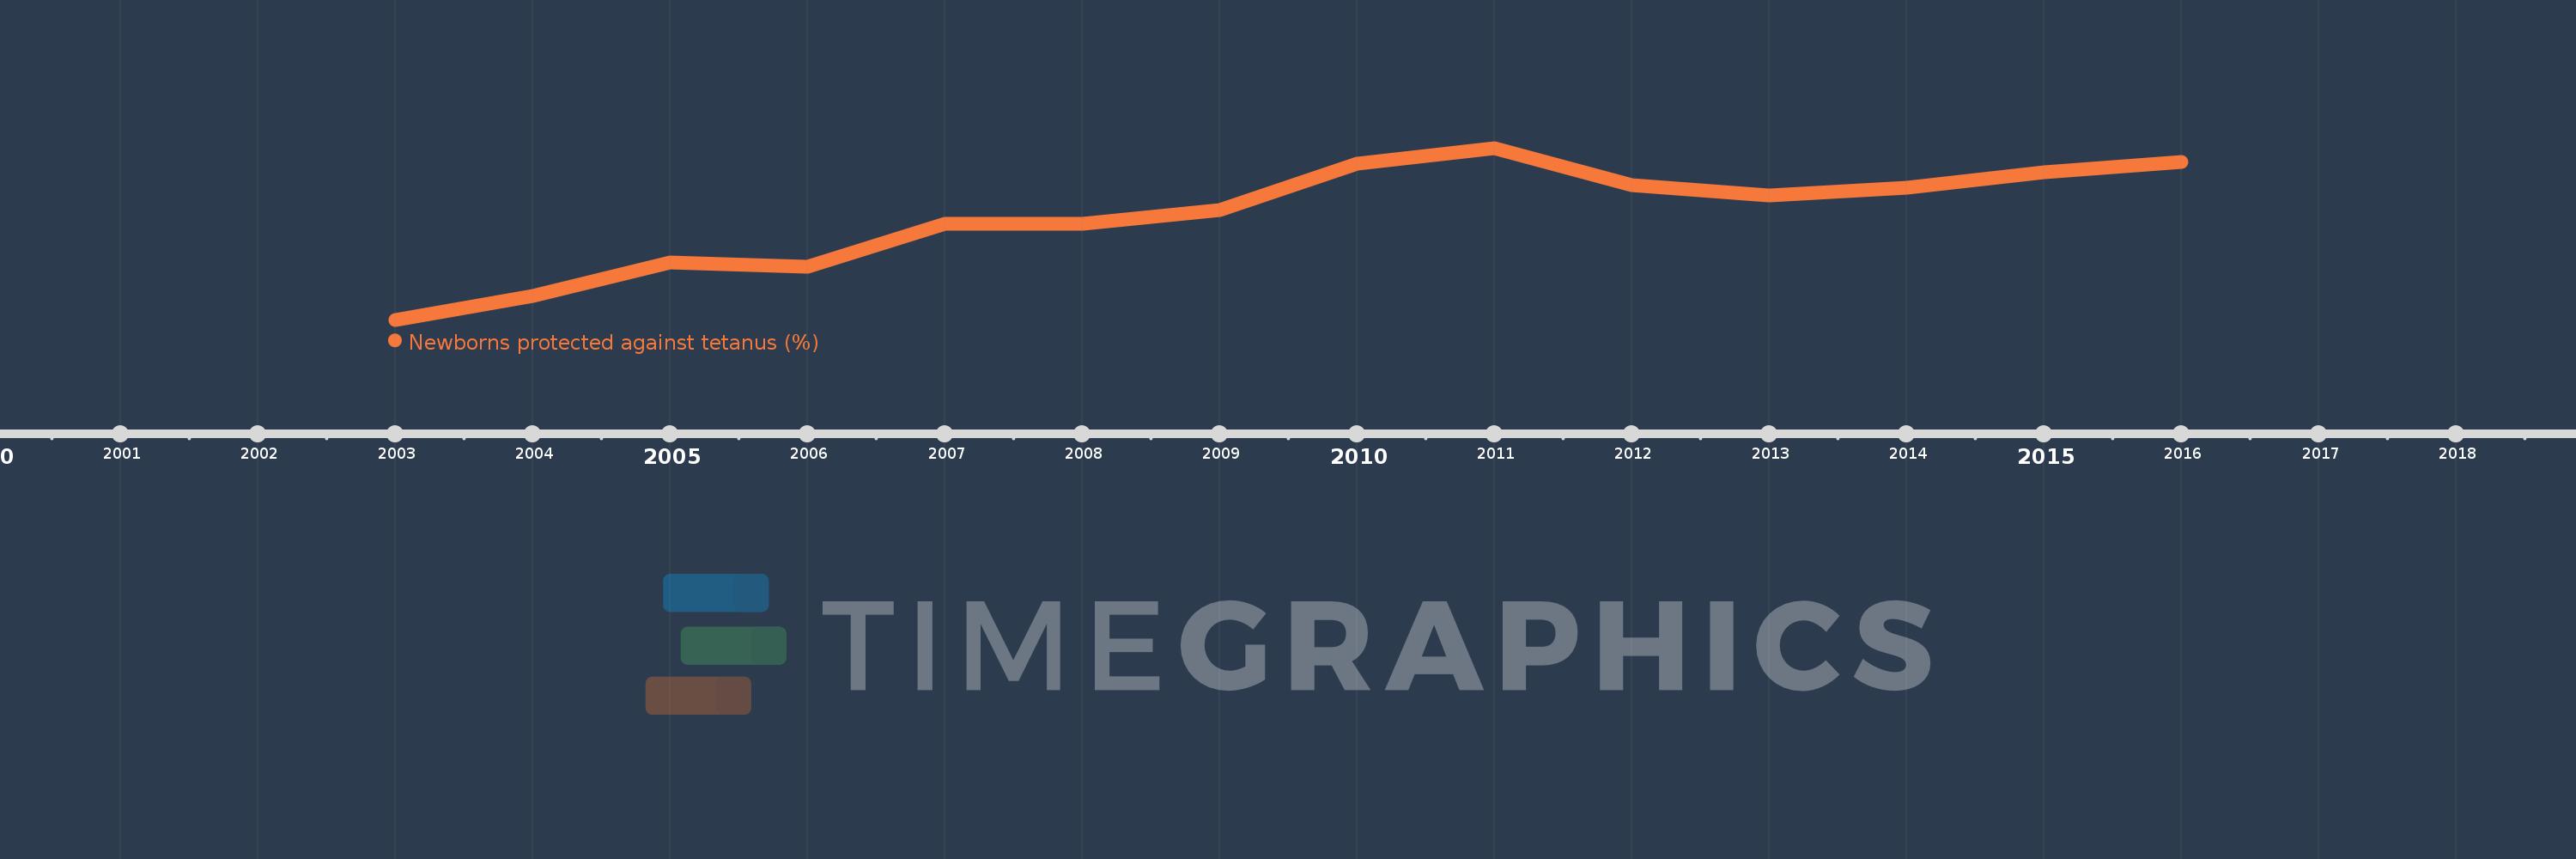
Newborns protected against tetanus (%)
2016,2015,2014,2013,2012,2011,2010,2009,2008,2007,2006,2005,2004,2003
This statistics in other country:
Timeline:
This timeline shows a graph from 2003 to 2016 of IDA & IBRD total. No data until 2002. Number of actual observations by date: 14.
Source name:
World Development Indicators
Source organization:
WHO and UNICEF (http://www.who.int/immunization/monitoring_surveillance/en/).
Categories, topics:
Health
Last updated:
apr 23, 2017
Indicators value changes by year
Minimum:
76.095
jan 1, 2003
Maximum:
83.825
jan 1, 2011
At the date of observation
Value
Absolute change
Change from previous value
jan 1, 2003
76.095
+76.095
0.0%
jan 1, 2004
77.18
+1.085
1.43%
jan 1, 2005
78.66
+1.479
1.92%
jan 1, 2006
78.482
-0.178
-0.23%
jan 1, 2007
80.407
+1.925
2.45%
jan 1, 2008
80.412
+0.005
0.01%
jan 1, 2009
81.015
+0.603
0.75%
jan 1, 2010
83.116
+2.102
2.59%
jan 1, 2011
83.825
+0.708
0.85%
jan 1, 2012
82.166
-1.659
-1.98%
jan 1, 2013
81.684
-0.482
-0.59%
jan 1, 2014
82.022
+0.338
0.41%
jan 1, 2015
82.746
+0.724
0.88%
jan 1, 2016
83.189
+0.443
0.54%
Ranking of countries by current statistics by years


Comments: