29
/
en
AIzaSyAYiBZKx7MnpbEhh9jyipgxe19OcubqV5w
April 1, 2024
26771
Early-demographic dividend
EAR
false
2
1
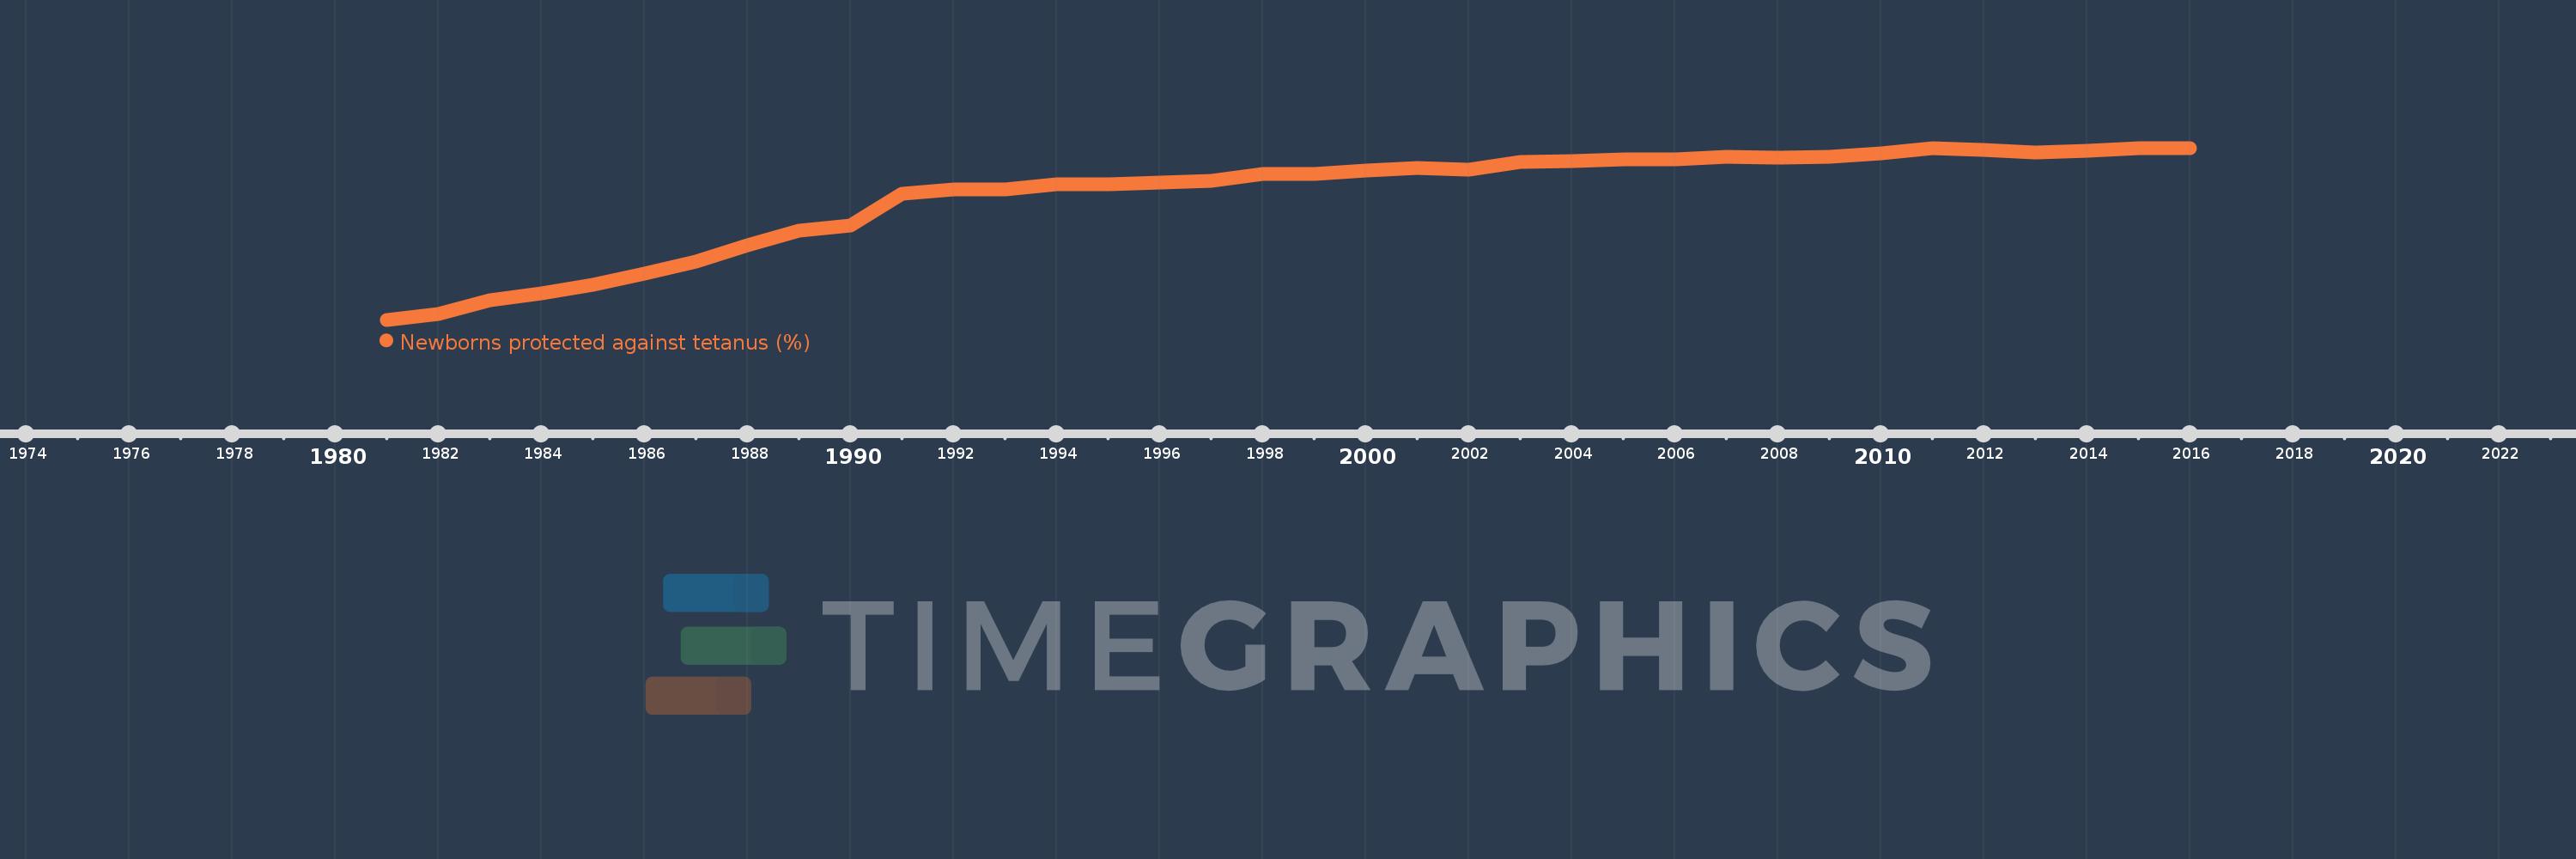
Newborns protected against tetanus (%)
2016,2015,2014,2013,2012,2011,2010,2009,2008,2007,2006,2005,2004,2003,2002,2001,2000,1999,1998,1997,1996,1995,1994,1993,1992,1991,1990,1989,1988,1987,1986,1985,1984,1983,1982,1981
This statistics in other country:
Timeline:
This timeline shows a graph from 1981 to 2016 of Early-demographic dividend. No data until 1980. Number of actual observations by date: 36.
Source name:
World Development Indicators
Source organization:
WHO and UNICEF (http://www.who.int/immunization/monitoring_surveillance/en/).
Categories, topics:
Health
Last updated:
apr 23, 2017
Indicators value changes by year
Minimum:
13.607
jan 1, 1981
Maximum:
85.887
jan 1, 2016
At the date of observation
Value
Absolute change
Change from previous value
jan 1, 1981
13.607
+13.607
0.0%
jan 1, 1982
15.919
+2.313
17.0%
jan 1, 1983
21.84
+5.921
37.19%
jan 1, 1984
24.542
+2.702
12.37%
jan 1, 1985
28.198
+3.656
14.9%
jan 1, 1986
33.032
+4.834
17.14%
jan 1, 1987
38.131
+5.099
15.44%
jan 1, 1988
45.022
+6.891
18.07%
jan 1, 1989
51.219
+6.197
13.76%
jan 1, 1990
53.375
+2.156
4.21%
jan 1, 1991
66.481
+13.106
24.55%
jan 1, 1992
68.556
+2.075
3.12%
jan 1, 1993
68.254
-0.302
-0.44%
jan 1, 1994
70.547
+2.293
3.36%
jan 1, 1995
70.704
+0.157
0.22%
jan 1, 1996
71.302
+0.599
0.85%
jan 1, 1997
72.007
+0.705
0.99%
jan 1, 1998
75.024
+3.017
4.19%
jan 1, 1999
74.832
-0.192
-0.26%
jan 1, 2000
76.238
+1.406
1.88%
jan 1, 2001
77.41
+1.172
1.54%
jan 1, 2002
76.859
-0.552
-0.71%
jan 1, 2003
79.985
+3.127
4.07%
jan 1, 2004
80.201
+0.215
0.27%
jan 1, 2005
81.166
+0.965
1.2%
jan 1, 2006
81.073
-0.092
-0.11%
jan 1, 2007
82.249
+1.176
1.45%
jan 1, 2008
81.952
-0.298
-0.36%
jan 1, 2009
82.081
+0.129
0.16%
jan 1, 2010
83.619
+1.538
1.87%
jan 1, 2011
85.675
+2.056
2.46%
jan 1, 2012
85.04
-0.635
-0.74%
jan 1, 2013
84.112
-0.929
-1.09%
jan 1, 2014
84.635
+0.523
0.62%
jan 1, 2015
85.617
+0.981
1.16%
jan 1, 2016
85.887
+0.271
0.32%
Ranking of countries by current statistics by years


Comments: