29
/
en
AIzaSyAYiBZKx7MnpbEhh9jyipgxe19OcubqV5w
April 1, 2024
39309
IDA only
IDX
false
2
1
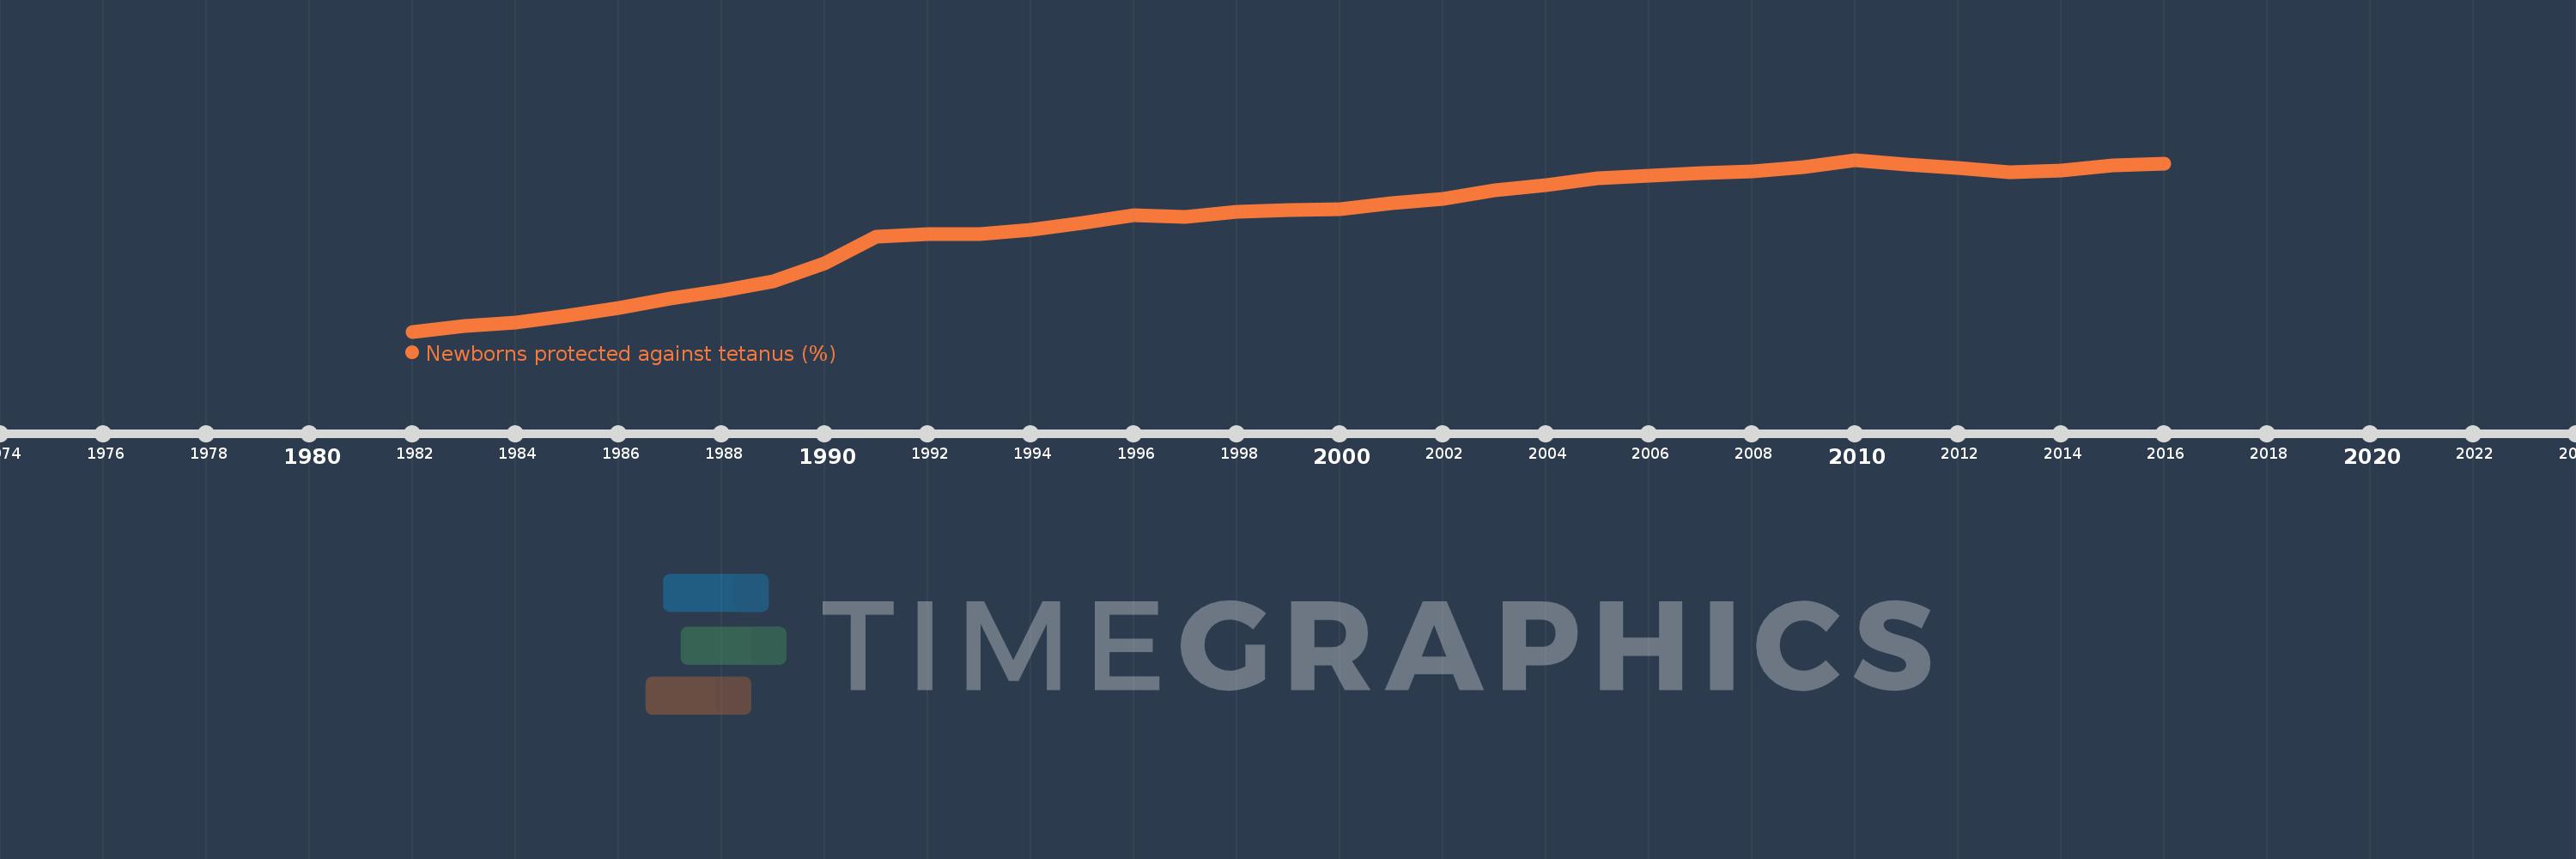
Newborns protected against tetanus (%)
2016,2015,2014,2013,2012,2011,2010,2009,2008,2007,2006,2005,2004,2003,2002,2001,2000,1999,1998,1997,1996,1995,1994,1993,1992,1991,1990,1989,1988,1987,1986,1985,1984,1983,1982
This statistics in other country:
Timeline:
This timeline shows a graph from 1982 to 2016 of IDA only. No data until 1981. Number of actual observations by date: 35.
Source name:
World Development Indicators
Source organization:
WHO and UNICEF (http://www.who.int/immunization/monitoring_surveillance/en/).
Categories, topics:
Health
Last updated:
apr 23, 2017
Indicators value changes by year
Maximum:
85.552
jan 1, 2010
At the date of observation
Value
Absolute change
Change from previous value
jan 1, 1982
7.079
+7.079
0.0%
jan 1, 1983
9.66
+2.581
36.46%
jan 1, 1984
11.35
+1.69
17.5%
jan 1, 1985
14.366
+3.016
26.57%
jan 1, 1986
17.891
+3.525
24.54%
jan 1, 1987
22.223
+4.332
24.22%
jan 1, 1988
25.817
+3.594
16.17%
jan 1, 1989
30.164
+4.347
16.84%
jan 1, 1990
38.13
+7.966
26.41%
jan 1, 1991
50.261
+12.13
31.81%
jan 1, 1992
51.634
+1.373
2.73%
jan 1, 1993
51.421
-0.212
-0.41%
jan 1, 1994
53.537
+2.115
4.11%
jan 1, 1995
56.616
+3.08
5.75%
jan 1, 1996
60.112
+3.496
6.18%
jan 1, 1997
59.432
-0.68
-1.13%
jan 1, 1998
61.885
+2.453
4.13%
jan 1, 1999
62.424
+0.539
0.87%
jan 1, 2000
62.973
+0.549
0.88%
jan 1, 2001
65.898
+2.925
4.64%
jan 1, 2002
67.71
+1.811
2.75%
jan 1, 2003
71.809
+4.099
6.05%
jan 1, 2004
73.841
+2.032
2.83%
jan 1, 2005
77.205
+3.363
4.55%
jan 1, 2006
78.349
+1.144
1.48%
jan 1, 2007
79.665
+1.316
1.68%
jan 1, 2008
80.247
+0.582
0.73%
jan 1, 2009
82.101
+1.855
2.31%
jan 1, 2010
85.552
+3.451
4.2%
jan 1, 2011
83.481
-2.071
-2.42%
jan 1, 2012
81.813
-1.668
-2.0%
jan 1, 2013
79.745
-2.068
-2.53%
jan 1, 2014
80.597
+0.852
1.07%
jan 1, 2015
82.818
+2.221
2.76%
jan 1, 2016
83.739
+0.921
1.11%
Ranking of countries by current statistics by years


Comments: