29
/
en
AIzaSyAYiBZKx7MnpbEhh9jyipgxe19OcubqV5w
April 1, 2024
54313
Pacific island small states
PSS
false
2
1
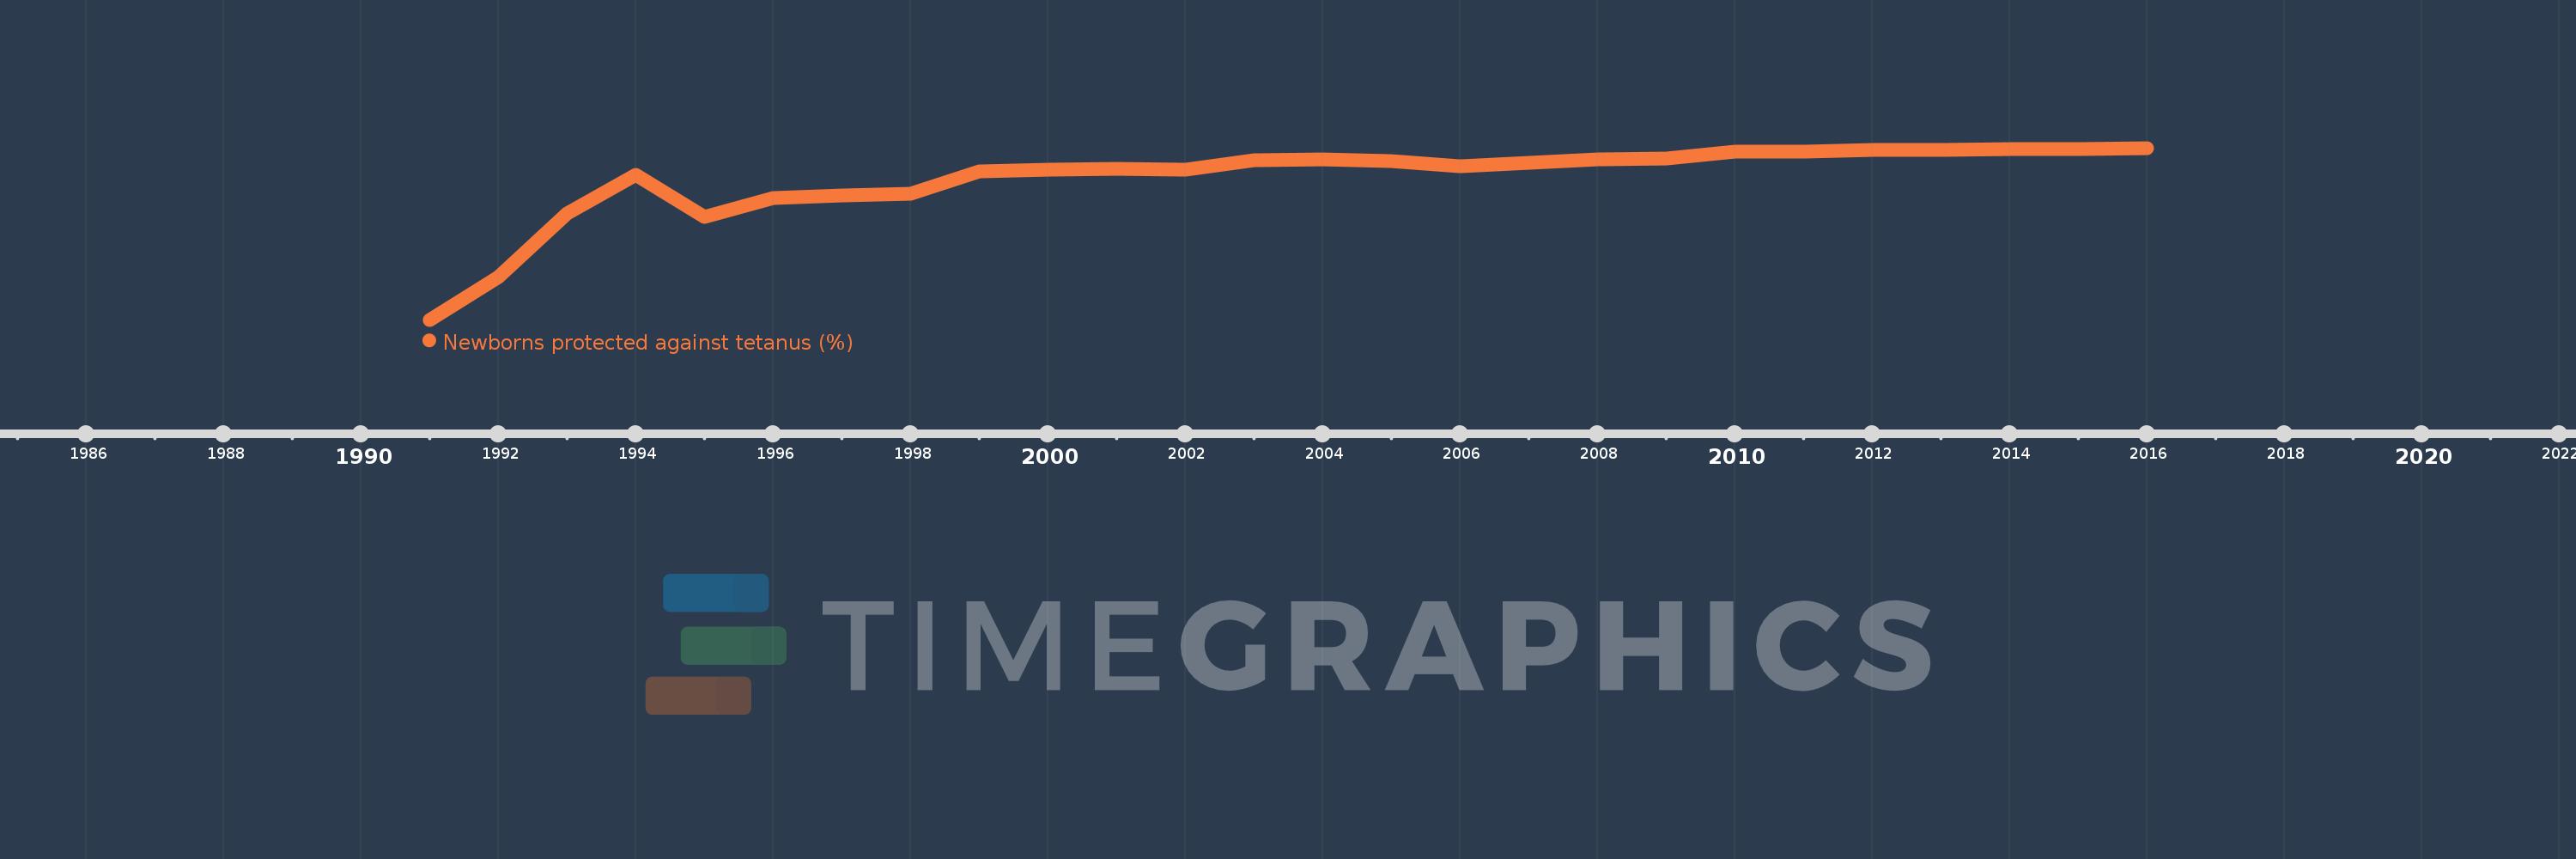
Newborns protected against tetanus (%)
2016,2015,2014,2013,2012,2011,2010,2009,2008,2007,2006,2005,2004,2003,2002,2001,2000,1999,1998,1997,1996,1995,1994,1993,1992,1991
This statistics in other country:
Timeline:
This timeline shows a graph from 1991 to 2016 of Pacific island small states. No data until 1990. Number of actual observations by date: 26.
Source name:
World Development Indicators
Source organization:
WHO and UNICEF (http://www.who.int/immunization/monitoring_surveillance/en/).
Categories, topics:
Health
Last updated:
apr 23, 2017
Indicators value changes by year
Minimum:
31.813
jan 1, 1991
Maximum:
87.801
jan 1, 2016
At the date of observation
Value
Absolute change
Change from previous value
jan 1, 1991
31.813
+31.813
0.0%
jan 1, 1992
45.675
+13.863
43.58%
jan 1, 1993
66.515
+20.839
45.63%
jan 1, 1994
79.133
+12.618
18.97%
jan 1, 1995
65.265
-13.868
-17.52%
jan 1, 1996
71.45
+6.184
9.48%
jan 1, 1997
72.372
+0.922
1.29%
jan 1, 1998
72.922
+0.55
0.76%
jan 1, 1999
80.165
+7.243
9.93%
jan 1, 2000
80.799
+0.634
0.79%
jan 1, 2001
81.045
+0.246
0.3%
jan 1, 2002
80.655
-0.39
-0.48%
jan 1, 2003
83.795
+3.14
3.89%
jan 1, 2004
83.954
+0.159
0.19%
jan 1, 2005
83.579
-0.375
-0.45%
jan 1, 2006
81.818
-1.761
-2.11%
jan 1, 2007
82.879
+1.061
1.3%
jan 1, 2008
84.08
+1.201
1.45%
jan 1, 2009
84.293
+0.212
0.25%
jan 1, 2010
86.623
+2.331
2.77%
jan 1, 2011
86.627
+0.004
0.0%
jan 1, 2012
87.061
+0.433
0.5%
jan 1, 2013
87.143
+0.082
0.09%
jan 1, 2014
87.438
+0.295
0.34%
jan 1, 2015
87.388
-0.05
-0.06%
jan 1, 2016
87.801
+0.413
0.47%
Ranking of countries by current statistics by years


Comments: