29
/
en
AIzaSyAYiBZKx7MnpbEhh9jyipgxe19OcubqV5w
April 1, 2024
36409
IBRD only
IBD
false
2
1
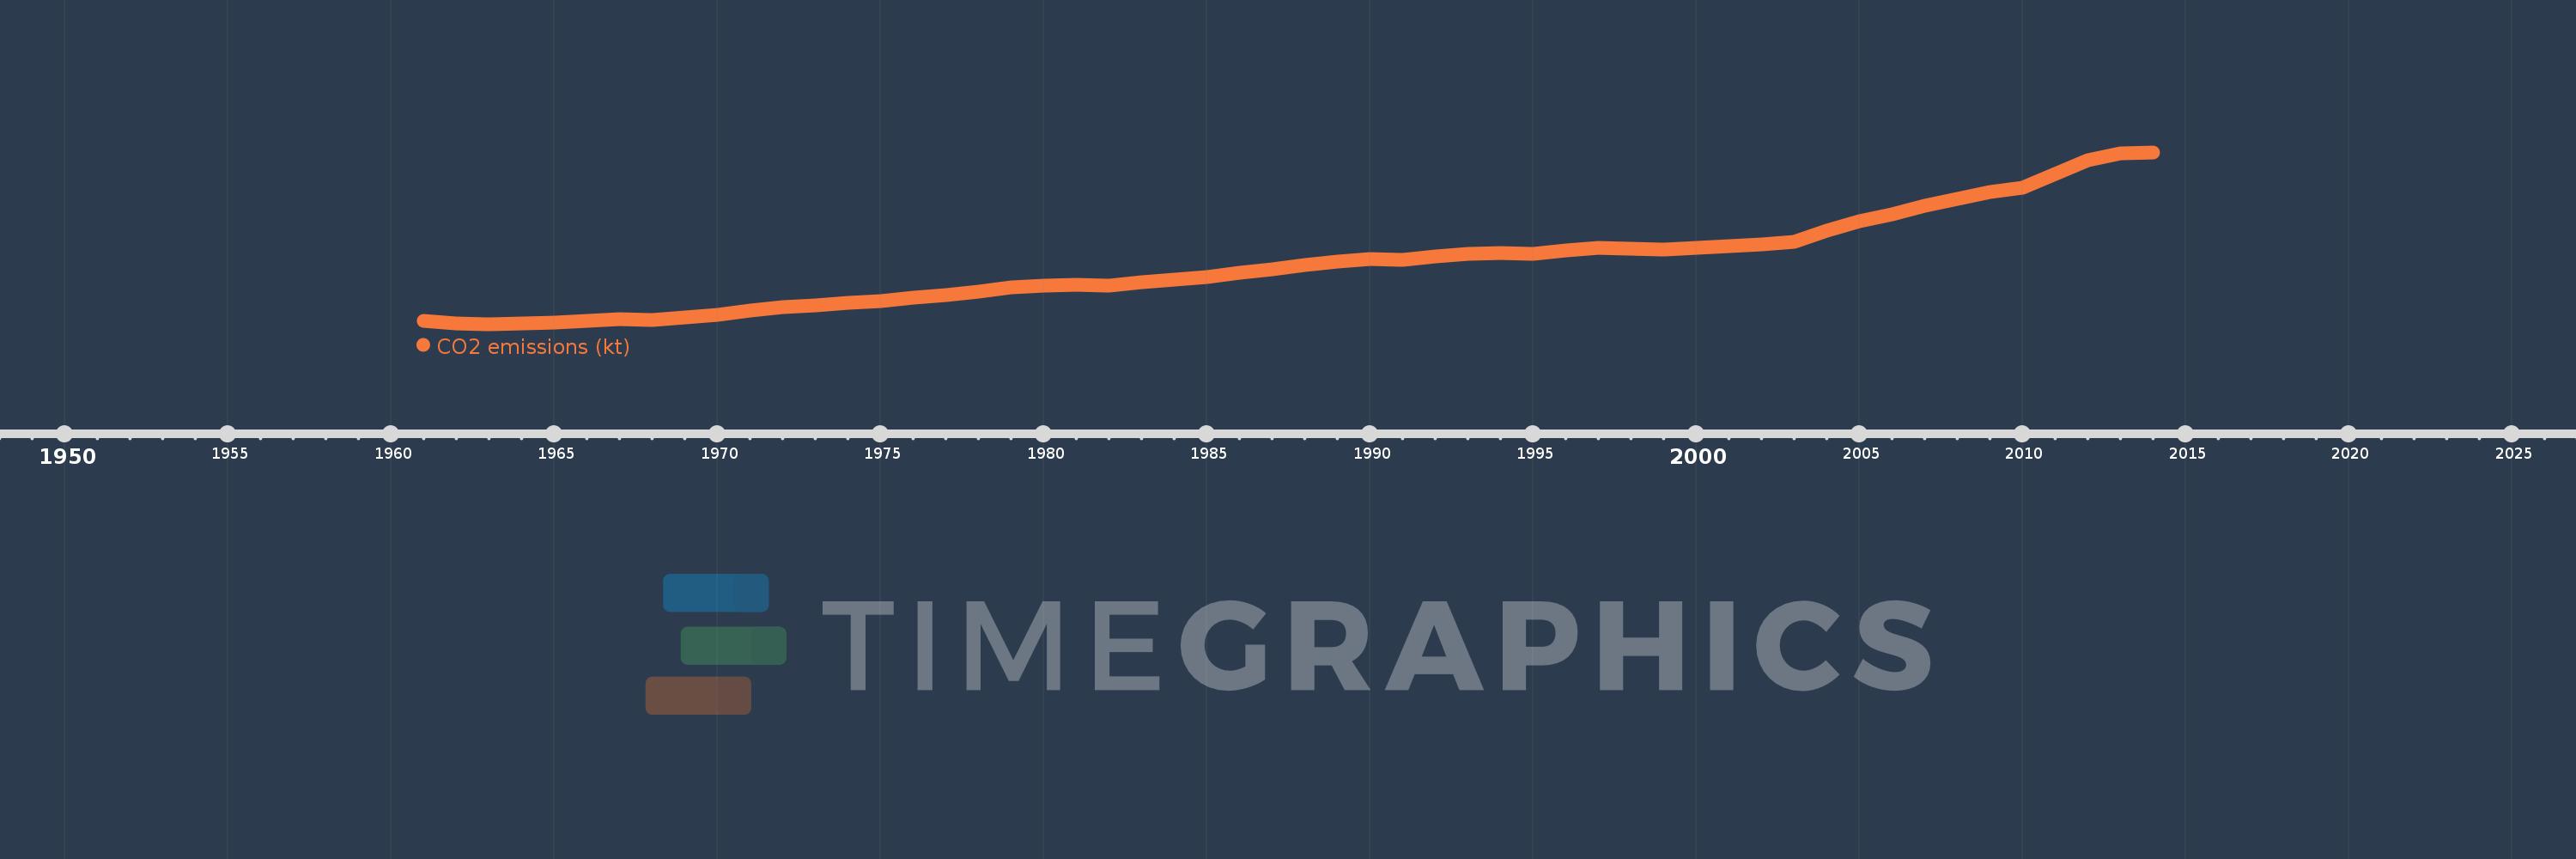
CO2 emissions (kt)
2014,2013,2012,2011,2010,2009,2008,2007,2006,2005,2004,2003,2002,2001,2000,1999,1998,1997,1996,1995,1994,1993,1992,1991,1990,1989,1988,1987,1986,1985,1984,1983,1982,1981,1980,1979,1978,1977,1976,1975,1974,1973,1972,1971,1970,1969,1968,1967,1966,1965,1964,1963,1962,1961
This statistics in other country:
AfghanistanAlbaniaAlgeriaAndorraAngolaAntigua and BarbudaArab WorldArgentinaArmeniaArubaAustraliaAustriaAzerbaijanBahamas, TheBahrainBangladeshBarbadosBelarusBelgiumBelizeBeninBermudaBhutanBoliviaBosnia and HerzegovinaBotswanaBrazilBritish Virgin IslandsBrunei DarussalamBulgariaBurkina FasoBurundiCabo VerdeCambodiaCameroonCanadaCaribbean small statesCayman IslandsCentral African RepublicCentral Europe and the BalticsChadChileChinaColombiaComorosCongo, Dem. Rep.Congo, Rep.Costa RicaCote d'IvoireCroatiaCubaCuracaoCyprusCzech RepublicDenmarkDjiboutiDominicaDominican RepublicEarly-demographic dividendEast Asia & PacificEast Asia & Pacific (excluding high income)East Asia & Pacific (IDA & IBRD countries)EcuadorEgypt, Arab Rep.El SalvadorEquatorial GuineaEritreaEstoniaEthiopiaEuro areaEurope & Central AsiaEurope & Central Asia (excluding high income)Europe & Central Asia (IDA & IBRD countries)European UnionFaroe IslandsFijiFinlandFragile and conflict affected situationsFranceFrench PolynesiaGabonGambia, TheGeorgiaGermanyGhanaGibraltarGreeceGreenlandGrenadaGuatemalaGuineaGuinea-BissauGuyanaHaitiHeavily indebted poor countries (HIPC)High incomeHondurasHong Kong SAR, ChinaHungaryIBRD onlyIcelandIDA & IBRD totalIDA blendIDA onlyIDA totalIndiaIndonesiaIran, Islamic Rep.IraqIrelandIsraelItalyJamaicaJapanJordanKazakhstanKenyaKiribatiKorea, Dem. People’s Rep.Korea, Rep.KuwaitKyrgyz RepublicLao PDRLate-demographic dividendLatin America & Caribbean Latin America & Caribbean (excluding high income)Latin America & the Caribbean (IDA & IBRD countries)LatviaLeast developed countries: UN classificationLebanonLesothoLiberiaLibyaLiechtensteinLithuaniaLow & middle incomeLow incomeLower middle incomeLuxembourgMacao SAR, ChinaMacedonia, FYRMadagascarMalawiMalaysiaMaldivesMaliMaltaMarshall IslandsMauritaniaMauritiusMexicoMicronesia, Fed. Sts.Middle East & North AfricaMiddle East & North Africa (excluding high income)Middle East & North Africa (IDA & IBRD countries)Middle incomeMoldovaMongoliaMontenegroMoroccoMozambiqueMyanmarNamibiaNauruNepalNetherlandsNew CaledoniaNew ZealandNicaraguaNigerNigeriaNorth AmericaNorwayOECD membersOmanOther small statesPacific island small statesPakistanPalauPanamaPapua New GuineaParaguayPeruPhilippinesPolandPortugalPost-demographic dividendPre-demographic dividendQatarRomaniaRussian FederationRwandaSamoaSao Tome and PrincipeSaudi ArabiaSenegalSerbiaSeychellesSierra LeoneSingaporeSint Maarten (Dutch part)Slovak RepublicSloveniaSmall statesSolomon IslandsSomaliaSouth AfricaSouth AsiaSouth Asia (IDA & IBRD)South SudanSpainSri LankaSt. Kitts and NevisSt. LuciaSt. Vincent and the GrenadinesSub-Saharan Africa Sub-Saharan Africa (excluding high income)Sub-Saharan Africa (IDA & IBRD countries)SudanSurinameSwazilandSwedenSwitzerlandSyrian Arab RepublicTajikistanTanzaniaThailandTimor-LesteTogoTongaTrinidad and TobagoTunisiaTurkeyTurkmenistanTurks and Caicos IslandsUgandaUkraineUnited Arab EmiratesUnited KingdomUnited StatesUpper middle incomeUruguayUzbekistanVanuatuVenezuela, RBVietnamWest Bank and GazaWorldYemen, Rep.ZambiaZimbabwe Timeline:
This timeline shows a graph from 1961 to 2014 of IBRD only. No data until 1960. Number of actual observations by date: 54.
Source name:
World Development Indicators
Source organization:
Carbon Dioxide Information Analysis Center, Environmental Sciences Division, Oak Ridge National Laboratory, Tennessee, United States.
Categories, topics:
Climate Change, Environment
Last updated:
apr 23, 2017
Indicators value changes by year
Minimum:
2.186 mln
jan 1, 1963
Maximum:
20.358 mln
jan 1, 2014
At the date of observation
Value
Absolute change
Change from previous value
jan 1, 1961
2.545 mln
+2.545 mln
0.0%
jan 1, 1962
2.263 mln
-282.091K
-11.08%
jan 1, 1963
2.186 mln
-77.276K
-3.41%
jan 1, 1964
2.257 mln
+71.108K
3.25%
jan 1, 1965
2.365 mln
+107.762K
4.77%
jan 1, 1966
2.536 mln
+170.991K
7.23%
jan 1, 1967
2.71 mln
+174.251K
6.87%
jan 1, 1968
2.671 mln
-38.698K
-1.43%
jan 1, 1969
2.912 mln
+241.172K
9.03%
jan 1, 1970
3.219 mln
+306.984K
10.54%
jan 1, 1971
3.657 mln
+437.712K
13.6%
jan 1, 1972
3.965 mln
+308.152K
8.43%
jan 1, 1973
4.187 mln
+222.255K
5.61%
jan 1, 1974
4.446 mln
+258.469K
6.17%
jan 1, 1975
4.59 mln
+144.161K
3.24%
jan 1, 1976
4.965 mln
+374.661K
8.16%
jan 1, 1977
5.29 mln
+325.54K
6.56%
jan 1, 1978
5.644 mln
+353.886K
6.69%
jan 1, 1979
6.076 mln
+431.845K
7.65%
jan 1, 1980
6.293 mln
+217.003K
3.57%
jan 1, 1981
6.347 mln
+54.05K
0.86%
jan 1, 1982
6.288 mln
-59.068K
-0.93%
jan 1, 1983
6.652 mln
+364.21K
5.79%
jan 1, 1984
6.885 mln
+232.4K
3.49%
jan 1, 1985
7.214 mln
+329.533K
4.79%
jan 1, 1986
7.644 mln
+430.256K
5.96%
jan 1, 1987
7.969 mln
+324.443K
4.24%
jan 1, 1988
8.401 mln
+432.034K
5.42%
jan 1, 1989
8.806 mln
+404.685K
4.82%
jan 1, 1990
9.074 mln
+268.372K
3.05%
jan 1, 1991
9.002 mln
-71.74K
-0.79%
jan 1, 1992
9.359 mln
+357.101K
3.97%
jan 1, 1993
9.636 mln
+276.838K
2.96%
jan 1, 1994
9.677 mln
+40.528K
0.42%
jan 1, 1995
9.592 mln
-84.579K
-0.87%
jan 1, 1996
9.973 mln
+380.855K
3.97%
jan 1, 1997
10.242 mln
+268.922K
2.7%
jan 1, 1998
10.205 mln
-36.858K
-0.36%
jan 1, 1999
10.053 mln
-152.457K
-1.49%
jan 1, 2000
10.232 mln
+179.167K
1.78%
jan 1, 2001
10.42 mln
+188.642K
1.84%
jan 1, 2002
10.622 mln
+201.78K
1.94%
jan 1, 2003
10.883 mln
+260.691K
2.45%
jan 1, 2004
12.051 mln
+1.168 mln
10.74%
jan 1, 2005
13.084 mln
+1.033 mln
8.57%
jan 1, 2006
13.797 mln
+713.734K
5.46%
jan 1, 2007
14.742 mln
+944.776K
6.85%
jan 1, 2008
15.409 mln
+667.148K
4.53%
jan 1, 2009
16.209 mln
+799.186K
5.19%
jan 1, 2010
16.591 mln
+382.868K
2.36%
jan 1, 2011
18.102 mln
+1.511 mln
9.11%
jan 1, 2012
19.548 mln
+1.445 mln
7.99%
jan 1, 2013
20.257 mln
+708.728K
3.63%
jan 1, 2014
20.358 mln
+100.912K
0.5%
Ranking of countries by current statistics by years


Comments: