29
/
en
AIzaSyAYiBZKx7MnpbEhh9jyipgxe19OcubqV5w
April 1, 2024
154339
India
IND
true
2
1
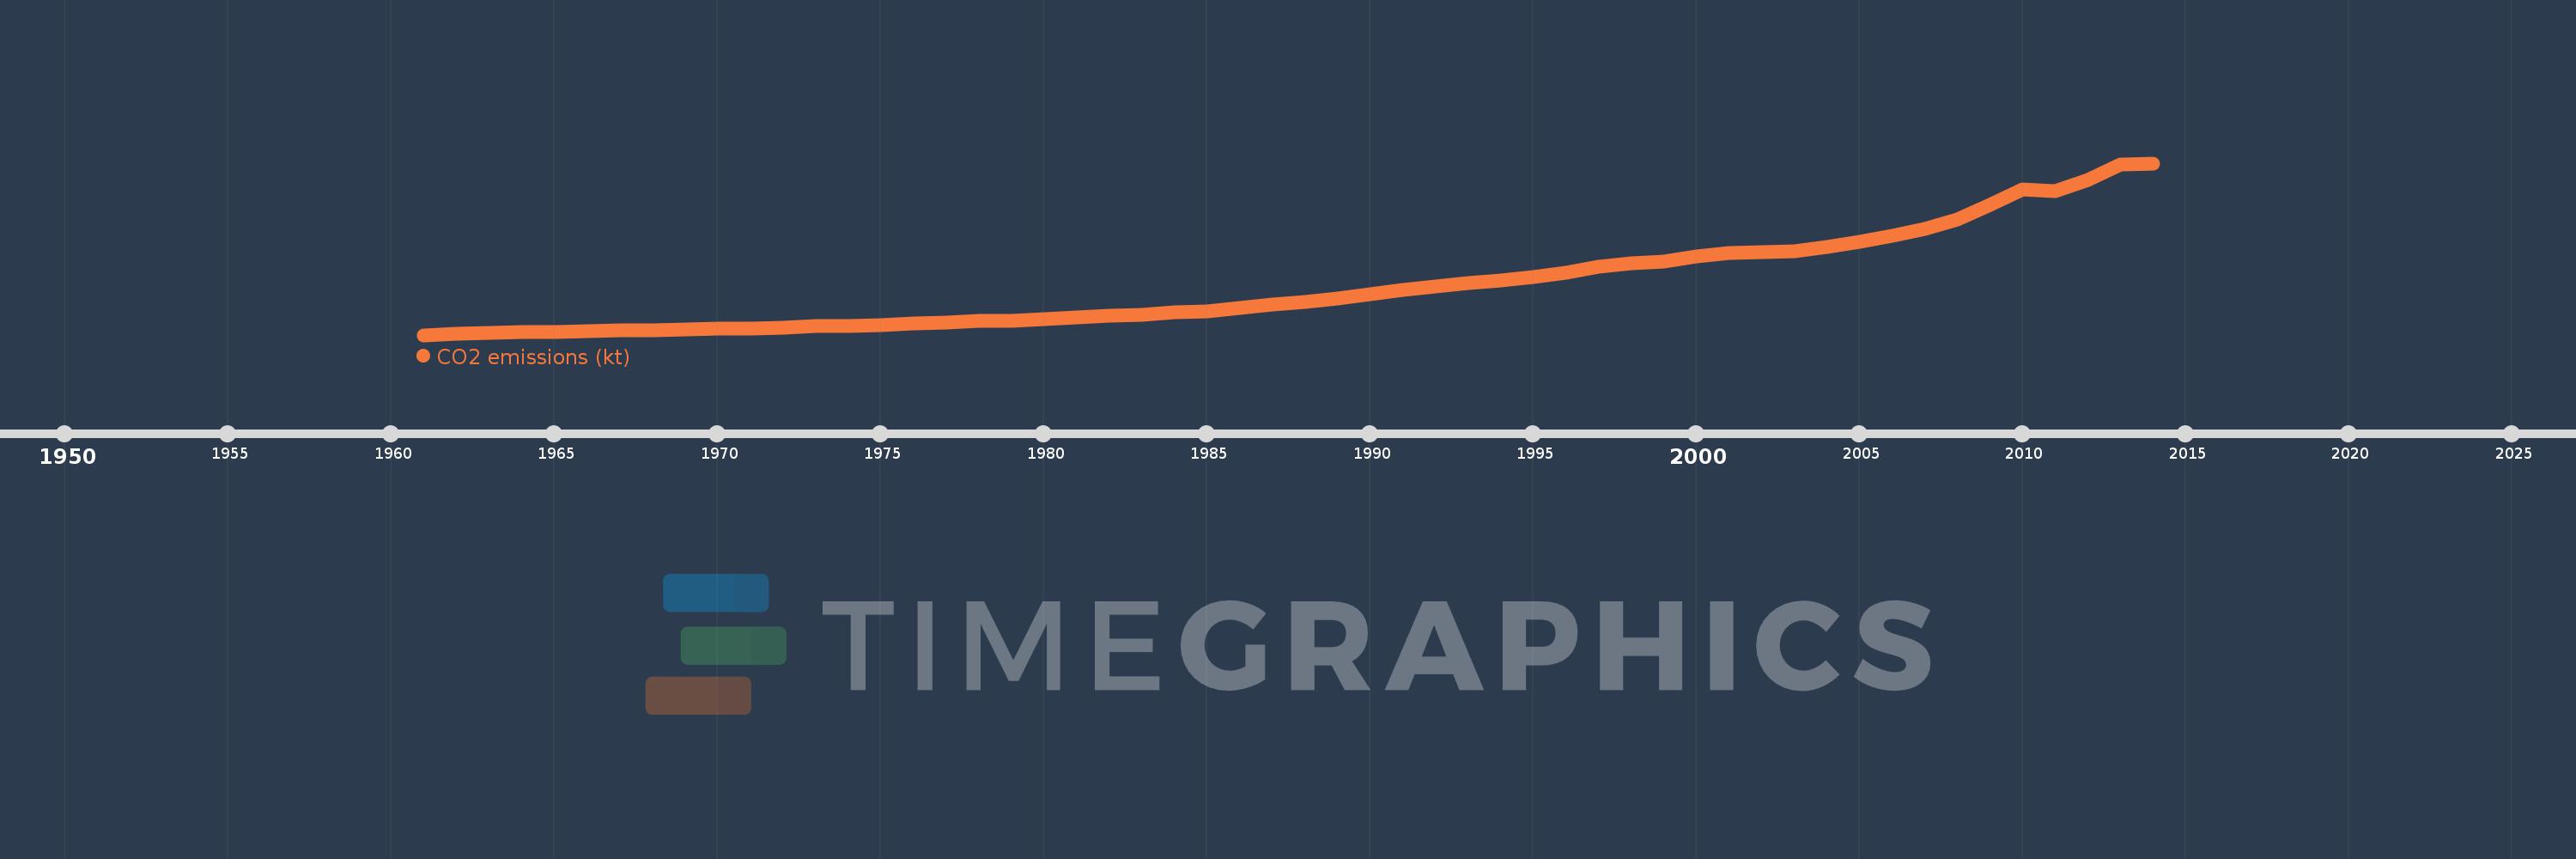
CO2 emissions (kt)
2014,2013,2012,2011,2010,2009,2008,2007,2006,2005,2004,2003,2002,2001,2000,1999,1998,1997,1996,1995,1994,1993,1992,1991,1990,1989,1988,1987,1986,1985,1984,1983,1982,1981,1980,1979,1978,1977,1976,1975,1974,1973,1972,1971,1970,1969,1968,1967,1966,1965,1964,1963,1962,1961
This statistics in other country:
AfghanistanAlbaniaAlgeriaAndorraAngolaAntigua and BarbudaArab WorldArgentinaArmeniaArubaAustraliaAustriaAzerbaijanBahamas, TheBahrainBangladeshBarbadosBelarusBelgiumBelizeBeninBermudaBhutanBoliviaBosnia and HerzegovinaBotswanaBrazilBritish Virgin IslandsBrunei DarussalamBulgariaBurkina FasoBurundiCabo VerdeCambodiaCameroonCanadaCaribbean small statesCayman IslandsCentral African RepublicCentral Europe and the BalticsChadChileChinaColombiaComorosCongo, Dem. Rep.Congo, Rep.Costa RicaCote d'IvoireCroatiaCubaCuracaoCyprusCzech RepublicDenmarkDjiboutiDominicaDominican RepublicEarly-demographic dividendEast Asia & PacificEast Asia & Pacific (excluding high income)East Asia & Pacific (IDA & IBRD countries)EcuadorEgypt, Arab Rep.El SalvadorEquatorial GuineaEritreaEstoniaEthiopiaEuro areaEurope & Central AsiaEurope & Central Asia (excluding high income)Europe & Central Asia (IDA & IBRD countries)European UnionFaroe IslandsFijiFinlandFragile and conflict affected situationsFranceFrench PolynesiaGabonGambia, TheGeorgiaGermanyGhanaGibraltarGreeceGreenlandGrenadaGuatemalaGuineaGuinea-BissauGuyanaHaitiHeavily indebted poor countries (HIPC)High incomeHondurasHong Kong SAR, ChinaHungaryIBRD onlyIcelandIDA & IBRD totalIDA blendIDA onlyIDA totalIndiaIndonesiaIran, Islamic Rep.IraqIrelandIsraelItalyJamaicaJapanJordanKazakhstanKenyaKiribatiKorea, Dem. People’s Rep.Korea, Rep.KuwaitKyrgyz RepublicLao PDRLate-demographic dividendLatin America & Caribbean Latin America & Caribbean (excluding high income)Latin America & the Caribbean (IDA & IBRD countries)LatviaLeast developed countries: UN classificationLebanonLesothoLiberiaLibyaLiechtensteinLithuaniaLow & middle incomeLow incomeLower middle incomeLuxembourgMacao SAR, ChinaMacedonia, FYRMadagascarMalawiMalaysiaMaldivesMaliMaltaMarshall IslandsMauritaniaMauritiusMexicoMicronesia, Fed. Sts.Middle East & North AfricaMiddle East & North Africa (excluding high income)Middle East & North Africa (IDA & IBRD countries)Middle incomeMoldovaMongoliaMontenegroMoroccoMozambiqueMyanmarNamibiaNauruNepalNetherlandsNew CaledoniaNew ZealandNicaraguaNigerNigeriaNorth AmericaNorwayOECD membersOmanOther small statesPacific island small statesPakistanPalauPanamaPapua New GuineaParaguayPeruPhilippinesPolandPortugalPost-demographic dividendPre-demographic dividendQatarRomaniaRussian FederationRwandaSamoaSao Tome and PrincipeSaudi ArabiaSenegalSerbiaSeychellesSierra LeoneSingaporeSint Maarten (Dutch part)Slovak RepublicSloveniaSmall statesSolomon IslandsSomaliaSouth AfricaSouth AsiaSouth Asia (IDA & IBRD)South SudanSpainSri LankaSt. Kitts and NevisSt. LuciaSt. Vincent and the GrenadinesSub-Saharan Africa Sub-Saharan Africa (excluding high income)Sub-Saharan Africa (IDA & IBRD countries)SudanSurinameSwazilandSwedenSwitzerlandSyrian Arab RepublicTajikistanTanzaniaThailandTimor-LesteTogoTongaTrinidad and TobagoTunisiaTurkeyTurkmenistanTurks and Caicos IslandsUgandaUkraineUnited Arab EmiratesUnited KingdomUnited StatesUpper middle incomeUruguayUzbekistanVanuatuVenezuela, RBVietnamWest Bank and GazaWorldYemen, Rep.ZambiaZimbabwe Timeline:
This timeline shows a graph from 1961 to 2014 of India. No data until 1960. Number of actual observations by date: 54.
Source name:
World Development Indicators
Source organization:
Carbon Dioxide Information Analysis Center, Environmental Sciences Division, Oak Ridge National Laboratory, Tennessee, United States.
Categories, topics:
Climate Change, Environment
Last updated:
apr 23, 2017
Indicators value changes by year
Minimum:
120.582K
jan 1, 1961
Maximum:
2.035 mln
jan 1, 2014
At the date of observation
Value
Absolute change
Change from previous value
jan 1, 1961
120.582K
+120.582K
0.0%
jan 1, 1962
130.402K
+9.82K
8.14%
jan 1, 1963
143.468K
+13.066K
10.02%
jan 1, 1964
154.084K
+10.616K
7.4%
jan 1, 1965
150.648K
-3.436K
-2.23%
jan 1, 1966
165.972K
+15.324K
10.17%
jan 1, 1967
171.766K
+5.794K
3.49%
jan 1, 1968
172.239K
+473.043
0.28%
jan 1, 1969
187.336K
+15.097K
8.77%
jan 1, 1970
190.724K
+3.388K
1.81%
jan 1, 1971
195.143K
+4.419K
2.32%
jan 1, 1972
205.869K
+10.726K
5.5%
jan 1, 1973
217.849K
+11.98K
5.82%
jan 1, 1974
224.343K
+6.494K
2.98%
jan 1, 1975
231.993K
+7.649K
3.41%
jan 1, 1976
252.202K
+20.209K
8.71%
jan 1, 1977
263.786K
+11.584K
4.59%
jan 1, 1978
279.051K
+15.266K
5.79%
jan 1, 1979
283.096K
+4.045K
1.45%
jan 1, 1980
296.891K
+13.795K
4.87%
jan 1, 1981
314.016K
+17.125K
5.77%
jan 1, 1982
338.838K
+24.822K
7.9%
jan 1, 1983
349.637K
+10.799K
3.19%
jan 1, 1984
378.669K
+29.032K
8.3%
jan 1, 1985
388.119K
+9.45K
2.5%
jan 1, 1986
426.674K
+38.555K
9.93%
jan 1, 1987
457.572K
+30.898K
7.24%
jan 1, 1988
488.481K
+30.909K
6.76%
jan 1, 1989
527.564K
+39.083K
8.0%
jan 1, 1990
579.008K
+51.444K
9.75%
jan 1, 1991
619.155K
+40.146K
6.93%
jan 1, 1992
658.19K
+39.035K
6.3%
jan 1, 1993
699.088K
+40.898K
6.21%
jan 1, 1994
723.697K
+24.609K
3.52%
jan 1, 1995
764.731K
+41.034K
5.67%
jan 1, 1996
811.562K
+46.831K
6.12%
jan 1, 1997
882.324K
+70.762K
8.72%
jan 1, 1998
917.685K
+35.361K
4.01%
jan 1, 1999
936.222K
+18.537K
2.02%
jan 1, 2000
995.767K
+59.545K
6.36%
jan 1, 2001
1.032 mln
+36.087K
3.62%
jan 1, 2002
1.041 mln
+9.3K
0.9%
jan 1, 2003
1.054 mln
+13.106K
1.26%
jan 1, 2004
1.1 mln
+45.339K
4.3%
jan 1, 2005
1.154 mln
+54.723K
4.98%
jan 1, 2006
1.223 mln
+68.243K
5.91%
jan 1, 2007
1.304 mln
+81.154K
6.64%
jan 1, 2008
1.408 mln
+103.89K
7.97%
jan 1, 2009
1.568 mln
+160.772K
11.42%
jan 1, 2010
1.739 mln
+170.266K
10.86%
jan 1, 2011
1.72 mln
-18.955K
-1.09%
jan 1, 2012
1.847 mln
+127.073K
7.39%
jan 1, 2013
2.019 mln
+171.74K
9.3%
jan 1, 2014
2.035 mln
+16.248K
0.8%
Ranking of countries by current statistics by years


Comments: