29
/
en
AIzaSyAYiBZKx7MnpbEhh9jyipgxe19OcubqV5w
April 1, 2024
189990
Mali
MLI
true
2
1
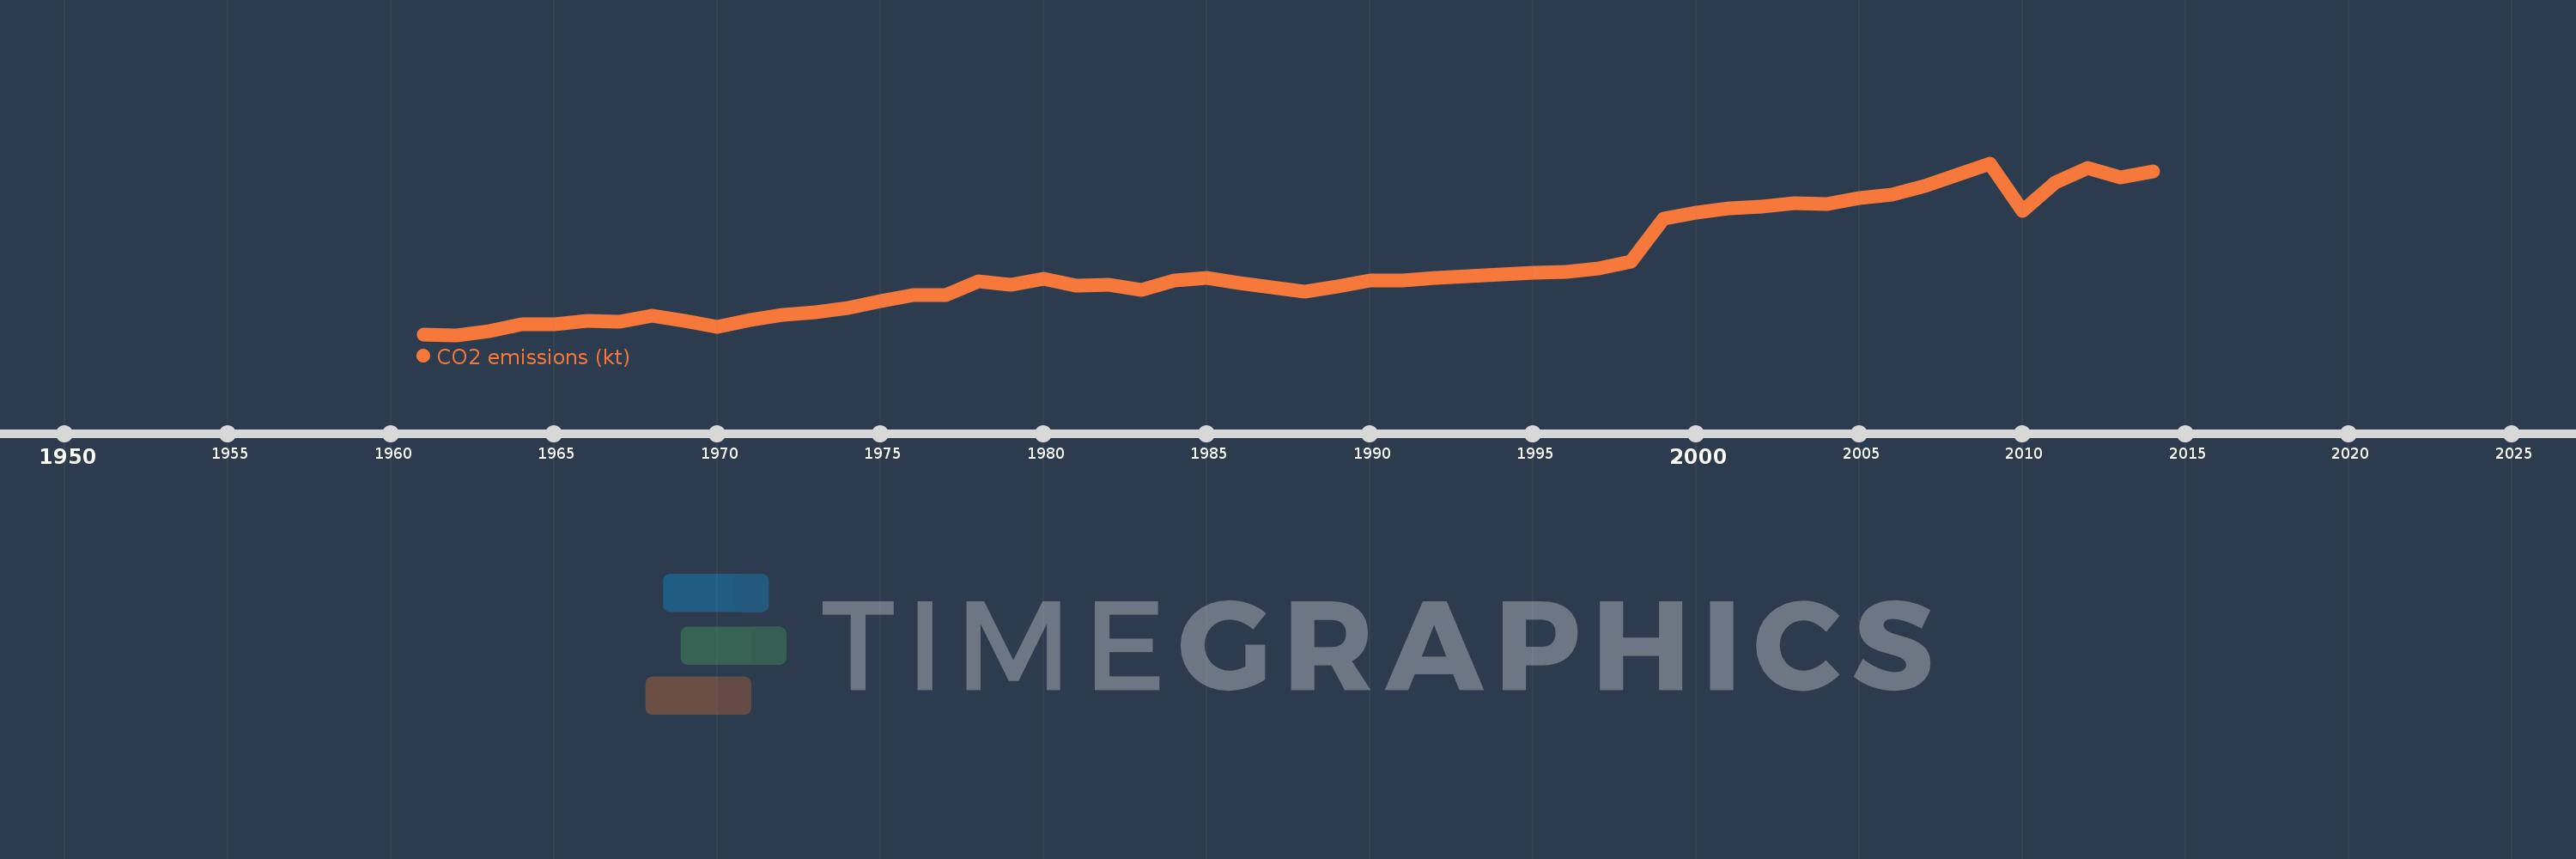
CO2 emissions (kt)
2014,2013,2012,2011,2010,2009,2008,2007,2006,2005,2004,2003,2002,2001,2000,1999,1998,1997,1996,1995,1994,1993,1992,1991,1990,1989,1988,1987,1986,1985,1984,1983,1982,1981,1980,1979,1978,1977,1976,1975,1974,1973,1972,1971,1970,1969,1968,1967,1966,1965,1964,1963,1962,1961
This statistics in other country:
AfghanistanAlbaniaAlgeriaAndorraAngolaAntigua and BarbudaArab WorldArgentinaArmeniaArubaAustraliaAustriaAzerbaijanBahamas, TheBahrainBangladeshBarbadosBelarusBelgiumBelizeBeninBermudaBhutanBoliviaBosnia and HerzegovinaBotswanaBrazilBritish Virgin IslandsBrunei DarussalamBulgariaBurkina FasoBurundiCabo VerdeCambodiaCameroonCanadaCaribbean small statesCayman IslandsCentral African RepublicCentral Europe and the BalticsChadChileChinaColombiaComorosCongo, Dem. Rep.Congo, Rep.Costa RicaCote d'IvoireCroatiaCubaCuracaoCyprusCzech RepublicDenmarkDjiboutiDominicaDominican RepublicEarly-demographic dividendEast Asia & PacificEast Asia & Pacific (excluding high income)East Asia & Pacific (IDA & IBRD countries)EcuadorEgypt, Arab Rep.El SalvadorEquatorial GuineaEritreaEstoniaEthiopiaEuro areaEurope & Central AsiaEurope & Central Asia (excluding high income)Europe & Central Asia (IDA & IBRD countries)European UnionFaroe IslandsFijiFinlandFragile and conflict affected situationsFranceFrench PolynesiaGabonGambia, TheGeorgiaGermanyGhanaGibraltarGreeceGreenlandGrenadaGuatemalaGuineaGuinea-BissauGuyanaHaitiHeavily indebted poor countries (HIPC)High incomeHondurasHong Kong SAR, ChinaHungaryIBRD onlyIcelandIDA & IBRD totalIDA blendIDA onlyIDA totalIndiaIndonesiaIran, Islamic Rep.IraqIrelandIsraelItalyJamaicaJapanJordanKazakhstanKenyaKiribatiKorea, Dem. People’s Rep.Korea, Rep.KuwaitKyrgyz RepublicLao PDRLate-demographic dividendLatin America & Caribbean Latin America & Caribbean (excluding high income)Latin America & the Caribbean (IDA & IBRD countries)LatviaLeast developed countries: UN classificationLebanonLesothoLiberiaLibyaLiechtensteinLithuaniaLow & middle incomeLow incomeLower middle incomeLuxembourgMacao SAR, ChinaMacedonia, FYRMadagascarMalawiMalaysiaMaldivesMaliMaltaMarshall IslandsMauritaniaMauritiusMexicoMicronesia, Fed. Sts.Middle East & North AfricaMiddle East & North Africa (excluding high income)Middle East & North Africa (IDA & IBRD countries)Middle incomeMoldovaMongoliaMontenegroMoroccoMozambiqueMyanmarNamibiaNauruNepalNetherlandsNew CaledoniaNew ZealandNicaraguaNigerNigeriaNorth AmericaNorwayOECD membersOmanOther small statesPacific island small statesPakistanPalauPanamaPapua New GuineaParaguayPeruPhilippinesPolandPortugalPost-demographic dividendPre-demographic dividendQatarRomaniaRussian FederationRwandaSamoaSao Tome and PrincipeSaudi ArabiaSenegalSerbiaSeychellesSierra LeoneSingaporeSint Maarten (Dutch part)Slovak RepublicSloveniaSmall statesSolomon IslandsSomaliaSouth AfricaSouth AsiaSouth Asia (IDA & IBRD)South SudanSpainSri LankaSt. Kitts and NevisSt. LuciaSt. Vincent and the GrenadinesSub-Saharan Africa Sub-Saharan Africa (excluding high income)Sub-Saharan Africa (IDA & IBRD countries)SudanSurinameSwazilandSwedenSwitzerlandSyrian Arab RepublicTajikistanTanzaniaThailandTimor-LesteTogoTongaTrinidad and TobagoTunisiaTurkeyTurkmenistanTurks and Caicos IslandsUgandaUkraineUnited Arab EmiratesUnited KingdomUnited StatesUpper middle incomeUruguayUzbekistanVanuatuVenezuela, RBVietnamWest Bank and GazaWorldYemen, Rep.ZambiaZimbabwe Timeline:
This timeline shows a graph from 1961 to 2014 of Mali. No data until 1960. Number of actual observations by date: 54.
Source name:
World Development Indicators
Source organization:
Carbon Dioxide Information Analysis Center, Environmental Sciences Division, Oak Ridge National Laboratory, Tennessee, United States.
Categories, topics:
Climate Change, Environment
Last updated:
apr 23, 2017
Indicators value changes by year
Minimum:
117.344
jan 1, 1962
Maximum:
1.071K
jan 1, 2009
At the date of observation
Value
Absolute change
Change from previous value
jan 1, 1961
121.011
+121.011
0.0%
jan 1, 1962
117.344
-3.667
-3.03%
jan 1, 1963
139.346
+22.002
18.75%
jan 1, 1964
176.016
+36.67
26.32%
jan 1, 1965
176.016
0.0
0.0%
jan 1, 1966
198.018
+22.002
12.5%
jan 1, 1967
190.684
-7.334
-3.7%
jan 1, 1968
223.687
+33.003
17.31%
jan 1, 1969
198.018
-25.669
-11.48%
jan 1, 1970
161.348
-36.67
-18.52%
jan 1, 1971
201.685
+40.337
25.0%
jan 1, 1972
227.354
+25.669
12.73%
jan 1, 1973
245.689
+18.335
8.06%
jan 1, 1974
267.691
+22.002
8.96%
jan 1, 1975
304.361
+36.67
13.7%
jan 1, 1976
341.031
+36.67
12.05%
jan 1, 1977
341.031
0.0
0.0%
jan 1, 1978
414.371
+73.34
21.51%
jan 1, 1979
396.036
-18.335
-4.42%
jan 1, 1980
429.039
+33.003
8.33%
jan 1, 1981
392.369
-36.67
-8.55%
jan 1, 1982
396.036
+3.667
0.93%
jan 1, 1983
366.7
-29.336
-7.41%
jan 1, 1984
418.038
+51.338
14.0%
jan 1, 1985
436.373
+18.335
4.39%
jan 1, 1986
407.037
-29.336
-6.72%
jan 1, 1987
381.368
-25.669
-6.31%
jan 1, 1988
359.366
-22.002
-5.77%
jan 1, 1989
385.035
+25.669
7.14%
jan 1, 1990
418.038
+33.003
8.57%
jan 1, 1991
421.705
+3.667
0.88%
jan 1, 1992
436.373
+14.668
3.48%
jan 1, 1993
443.707
+7.334
1.68%
jan 1, 1994
454.708
+11.001
2.48%
jan 1, 1995
462.042
+7.334
1.61%
jan 1, 1996
469.376
+7.334
1.59%
jan 1, 1997
487.711
+18.335
3.91%
jan 1, 1998
524.381
+36.67
7.52%
jan 1, 1999
762.736
+238.355
45.45%
jan 1, 2000
795.739
+33.003
4.33%
jan 1, 2001
821.408
+25.669
3.23%
jan 1, 2002
828.742
+7.334
0.89%
jan 1, 2003
847.077
+18.335
2.21%
jan 1, 2004
843.41
-3.667
-0.43%
jan 1, 2005
876.413
+33.003
3.91%
jan 1, 2006
898.415
+22.002
2.51%
jan 1, 2007
942.419
+44.004
4.9%
jan 1, 2008
1.008K
+66.006
7.0%
jan 1, 2009
1.071K
+62.339
6.18%
jan 1, 2010
806.74
-264.024
-24.66%
jan 1, 2011
964.421
+157.681
19.55%
jan 1, 2012
1.045K
+80.674
8.37%
jan 1, 2013
993.757
-51.338
-4.91%
jan 1, 2014
1.027K
+33.003
3.32%
Ranking of countries by current statistics by years


Comments: