29
/
en
AIzaSyAYiBZKx7MnpbEhh9jyipgxe19OcubqV5w
April 1, 2024
182784
Macao SAR, China
MAC
true
2
1
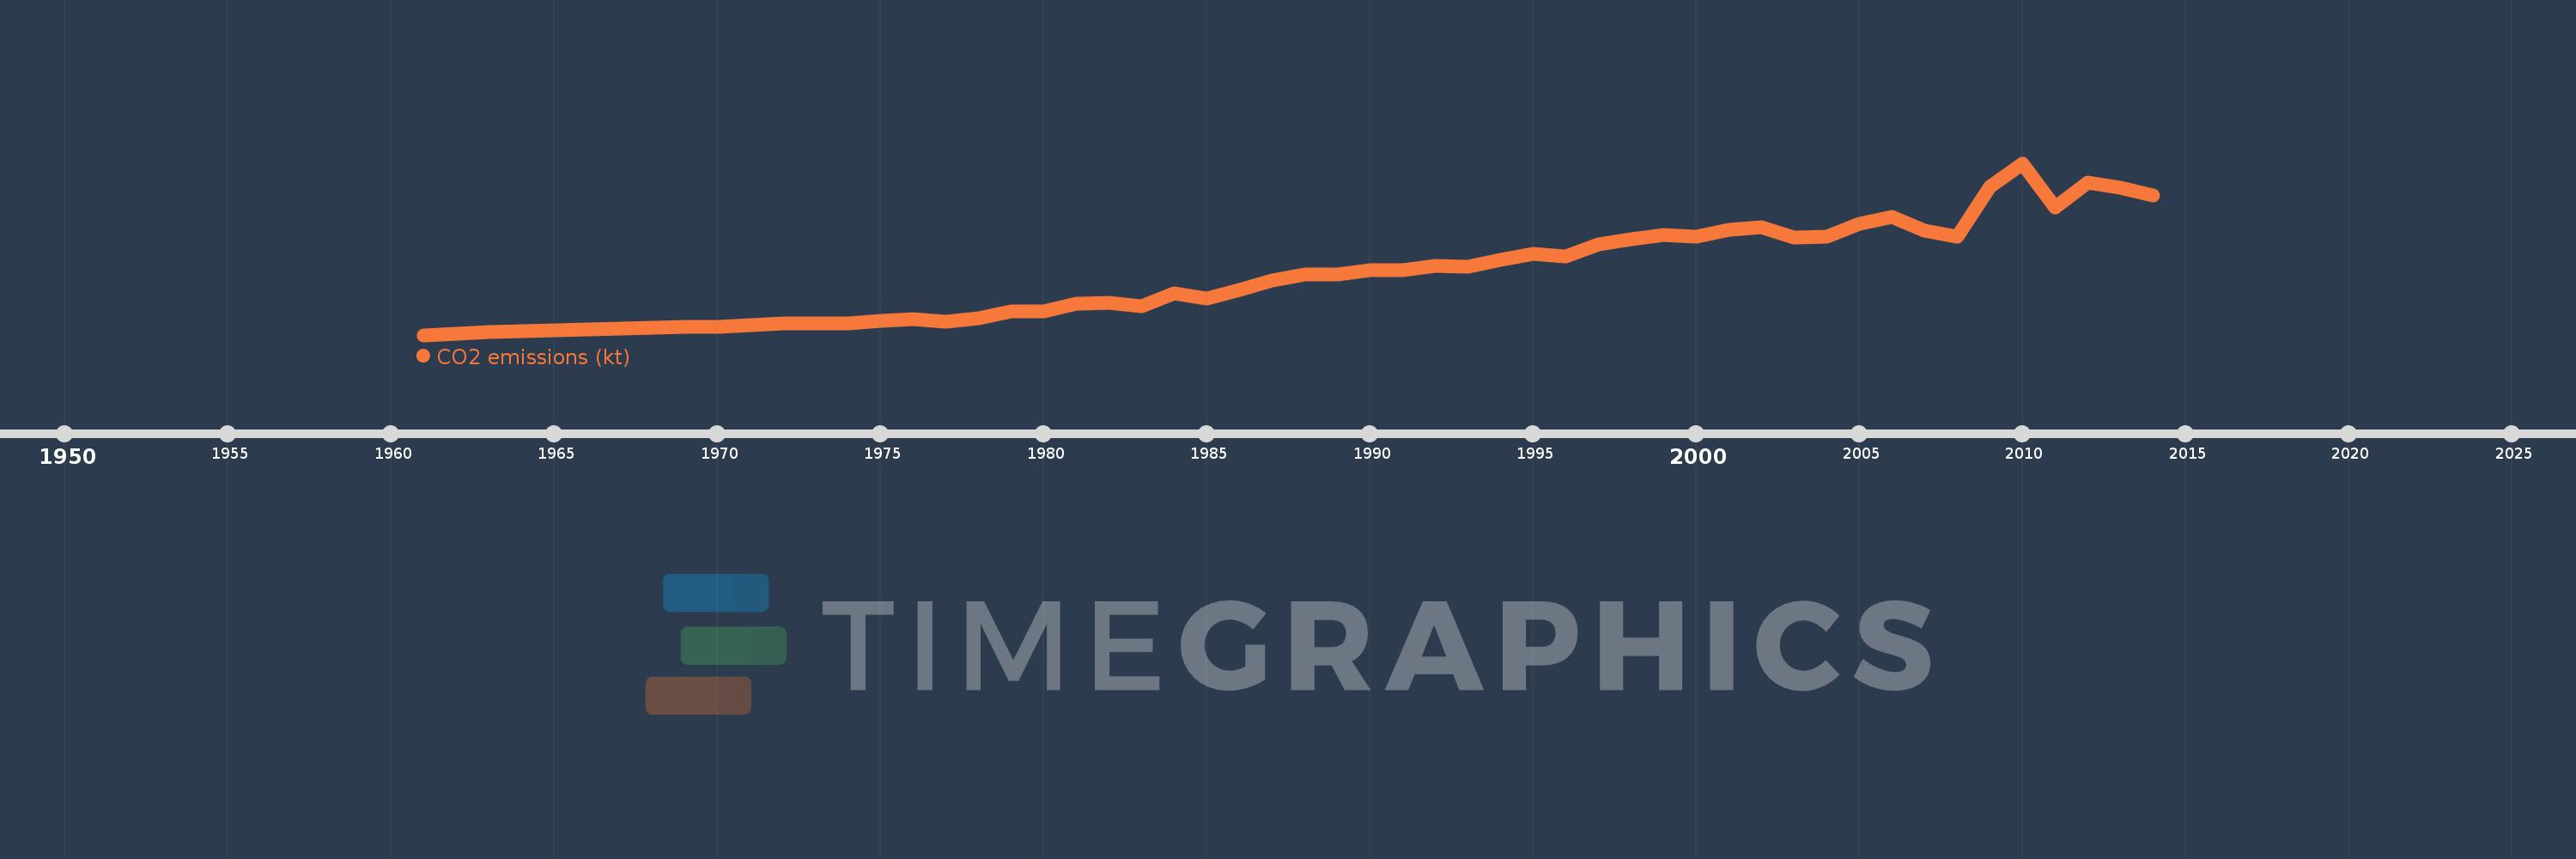
CO2 emissions (kt)
2014,2013,2012,2011,2010,2009,2008,2007,2006,2005,2004,2003,2002,2001,2000,1999,1998,1997,1996,1995,1994,1993,1992,1991,1990,1989,1988,1987,1986,1985,1984,1983,1982,1981,1980,1979,1978,1977,1976,1975,1974,1973,1972,1971,1970,1969,1968,1967,1966,1965,1964,1963,1962,1961
This statistics in other country:
AfghanistanAlbaniaAlgeriaAndorraAngolaAntigua and BarbudaArab WorldArgentinaArmeniaArubaAustraliaAustriaAzerbaijanBahamas, TheBahrainBangladeshBarbadosBelarusBelgiumBelizeBeninBermudaBhutanBoliviaBosnia and HerzegovinaBotswanaBrazilBritish Virgin IslandsBrunei DarussalamBulgariaBurkina FasoBurundiCabo VerdeCambodiaCameroonCanadaCaribbean small statesCayman IslandsCentral African RepublicCentral Europe and the BalticsChadChileChinaColombiaComorosCongo, Dem. Rep.Congo, Rep.Costa RicaCote d'IvoireCroatiaCubaCuracaoCyprusCzech RepublicDenmarkDjiboutiDominicaDominican RepublicEarly-demographic dividendEast Asia & PacificEast Asia & Pacific (excluding high income)East Asia & Pacific (IDA & IBRD countries)EcuadorEgypt, Arab Rep.El SalvadorEquatorial GuineaEritreaEstoniaEthiopiaEuro areaEurope & Central AsiaEurope & Central Asia (excluding high income)Europe & Central Asia (IDA & IBRD countries)European UnionFaroe IslandsFijiFinlandFragile and conflict affected situationsFranceFrench PolynesiaGabonGambia, TheGeorgiaGermanyGhanaGibraltarGreeceGreenlandGrenadaGuatemalaGuineaGuinea-BissauGuyanaHaitiHeavily indebted poor countries (HIPC)High incomeHondurasHong Kong SAR, ChinaHungaryIBRD onlyIcelandIDA & IBRD totalIDA blendIDA onlyIDA totalIndiaIndonesiaIran, Islamic Rep.IraqIrelandIsraelItalyJamaicaJapanJordanKazakhstanKenyaKiribatiKorea, Dem. People’s Rep.Korea, Rep.KuwaitKyrgyz RepublicLao PDRLate-demographic dividendLatin America & Caribbean Latin America & Caribbean (excluding high income)Latin America & the Caribbean (IDA & IBRD countries)LatviaLeast developed countries: UN classificationLebanonLesothoLiberiaLibyaLiechtensteinLithuaniaLow & middle incomeLow incomeLower middle incomeLuxembourgMacao SAR, ChinaMacedonia, FYRMadagascarMalawiMalaysiaMaldivesMaliMaltaMarshall IslandsMauritaniaMauritiusMexicoMicronesia, Fed. Sts.Middle East & North AfricaMiddle East & North Africa (excluding high income)Middle East & North Africa (IDA & IBRD countries)Middle incomeMoldovaMongoliaMontenegroMoroccoMozambiqueMyanmarNamibiaNauruNepalNetherlandsNew CaledoniaNew ZealandNicaraguaNigerNigeriaNorth AmericaNorwayOECD membersOmanOther small statesPacific island small statesPakistanPalauPanamaPapua New GuineaParaguayPeruPhilippinesPolandPortugalPost-demographic dividendPre-demographic dividendQatarRomaniaRussian FederationRwandaSamoaSao Tome and PrincipeSaudi ArabiaSenegalSerbiaSeychellesSierra LeoneSingaporeSint Maarten (Dutch part)Slovak RepublicSloveniaSmall statesSolomon IslandsSomaliaSouth AfricaSouth AsiaSouth Asia (IDA & IBRD)South SudanSpainSri LankaSt. Kitts and NevisSt. LuciaSt. Vincent and the GrenadinesSub-Saharan Africa Sub-Saharan Africa (excluding high income)Sub-Saharan Africa (IDA & IBRD countries)SudanSurinameSwazilandSwedenSwitzerlandSyrian Arab RepublicTajikistanTanzaniaThailandTimor-LesteTogoTongaTrinidad and TobagoTunisiaTurkeyTurkmenistanTurks and Caicos IslandsUgandaUkraineUnited Arab EmiratesUnited KingdomUnited StatesUpper middle incomeUruguayUzbekistanVanuatuVenezuela, RBVietnamWest Bank and GazaWorldYemen, Rep.ZambiaZimbabwe Timeline:
This timeline shows a graph from 1961 to 2014 of Macao SAR, China. No data until 1960. Number of actual observations by date: 54.
Source name:
World Development Indicators
Source organization:
Carbon Dioxide Information Analysis Center, Environmental Sciences Division, Oak Ridge National Laboratory, Tennessee, United States.
Categories, topics:
Climate Change, Environment
Last updated:
apr 23, 2017
Indicators value changes by year
Minimum:
51.338
jan 1, 1961
Maximum:
2.648K
jan 1, 2010
At the date of observation
Value
Absolute change
Change from previous value
jan 1, 1961
51.338
+51.338
0.0%
jan 1, 1962
69.673
+18.335
35.71%
jan 1, 1963
95.342
+25.669
36.84%
jan 1, 1964
106.343
+11.001
11.54%
jan 1, 1965
128.345
+22.002
20.69%
jan 1, 1966
132.012
+3.667
2.86%
jan 1, 1967
150.347
+18.335
13.89%
jan 1, 1968
165.015
+14.668
9.76%
jan 1, 1969
168.682
+3.667
2.22%
jan 1, 1970
168.682
0.0
0.0%
jan 1, 1971
205.352
+36.67
21.74%
jan 1, 1972
227.354
+22.002
10.71%
jan 1, 1973
231.021
+3.667
1.61%
jan 1, 1974
223.687
-7.334
-3.17%
jan 1, 1975
267.691
+44.004
19.67%
jan 1, 1976
297.027
+29.336
10.96%
jan 1, 1977
253.023
-44.004
-14.81%
jan 1, 1978
308.028
+55.005
21.74%
jan 1, 1979
414.371
+106.343
34.52%
jan 1, 1980
414.371
0.0
0.0%
jan 1, 1981
528.048
+113.677
27.43%
jan 1, 1982
535.382
+7.334
1.39%
jan 1, 1983
484.044
-51.338
-9.59%
jan 1, 1984
682.062
+198.018
40.91%
jan 1, 1985
605.055
-77.007
-11.29%
jan 1, 1986
733.4
+128.345
21.21%
jan 1, 1987
876.413
+143.013
19.5%
jan 1, 1988
971.755
+95.342
10.88%
jan 1, 1989
964.421
-7.334
-0.75%
jan 1, 1990
1.03K
+66.006
6.84%
jan 1, 1991
1.034K
+3.667
0.36%
jan 1, 1992
1.093K
+58.672
5.67%
jan 1, 1993
1.085K
-7.334
-0.67%
jan 1, 1994
1.188K
+102.676
9.46%
jan 1, 1995
1.283K
+95.342
8.02%
jan 1, 1996
1.243K
-40.337
-3.14%
jan 1, 1997
1.415K
+172.349
13.86%
jan 1, 1998
1.5K
+84.341
5.96%
jan 1, 1999
1.566K
+66.006
4.4%
jan 1, 2000
1.533K
-33.003
-2.11%
jan 1, 2001
1.635K
+102.676
6.7%
jan 1, 2002
1.687K
+51.338
3.14%
jan 1, 2003
1.525K
-161.348
-9.57%
jan 1, 2004
1.536K
+11.001
0.72%
jan 1, 2005
1.727K
+190.684
12.41%
jan 1, 2006
1.837K
+110.01
6.37%
jan 1, 2007
1.632K
-205.352
-11.18%
jan 1, 2008
1.544K
-88.008
-5.39%
jan 1, 2009
2.292K
+748.068
48.46%
jan 1, 2010
2.648K
+355.699
15.52%
jan 1, 2011
1.984K
-663.727
-25.07%
jan 1, 2012
2.358K
+374.034
18.85%
jan 1, 2013
2.274K
-84.341
-3.58%
jan 1, 2014
2.167K
-106.343
-4.68%
Ranking of countries by current statistics by years


Comments: