29
/
en
AIzaSyAYiBZKx7MnpbEhh9jyipgxe19OcubqV5w
April 1, 2024
85688
Bhutan
BTN
true
2
1
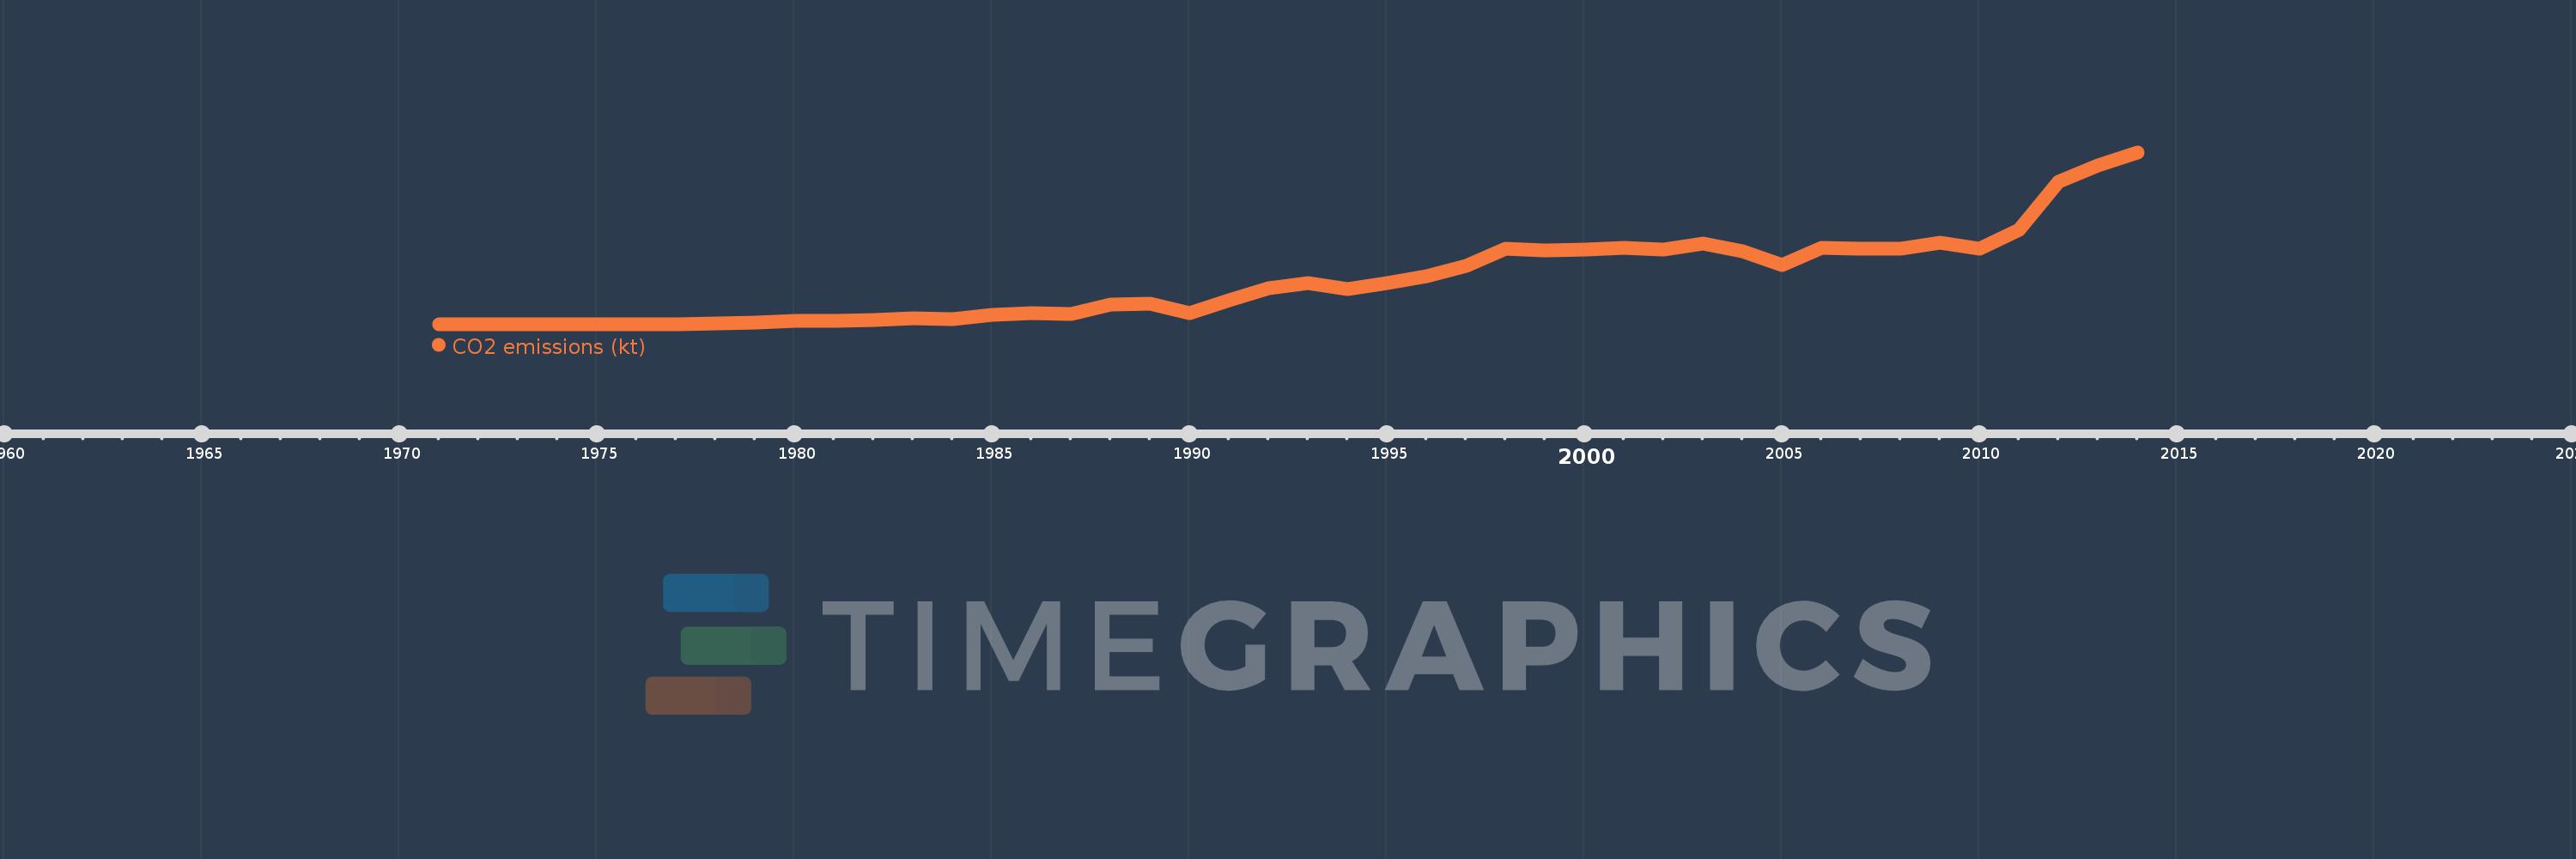
CO2 emissions (kt)
2014,2013,2012,2011,2010,2009,2008,2007,2006,2005,2004,2003,2002,2001,2000,1999,1998,1997,1996,1995,1994,1993,1992,1991,1990,1989,1988,1987,1986,1985,1984,1983,1982,1981,1980,1979,1978,1977,1976,1975,1974,1973,1972,1971
This statistics in other country:
AfghanistanAlbaniaAlgeriaAndorraAngolaAntigua and BarbudaArab WorldArgentinaArmeniaArubaAustraliaAustriaAzerbaijanBahamas, TheBahrainBangladeshBarbadosBelarusBelgiumBelizeBeninBermudaBhutanBoliviaBosnia and HerzegovinaBotswanaBrazilBritish Virgin IslandsBrunei DarussalamBulgariaBurkina FasoBurundiCabo VerdeCambodiaCameroonCanadaCaribbean small statesCayman IslandsCentral African RepublicCentral Europe and the BalticsChadChileChinaColombiaComorosCongo, Dem. Rep.Congo, Rep.Costa RicaCote d'IvoireCroatiaCubaCuracaoCyprusCzech RepublicDenmarkDjiboutiDominicaDominican RepublicEarly-demographic dividendEast Asia & PacificEast Asia & Pacific (excluding high income)East Asia & Pacific (IDA & IBRD countries)EcuadorEgypt, Arab Rep.El SalvadorEquatorial GuineaEritreaEstoniaEthiopiaEuro areaEurope & Central AsiaEurope & Central Asia (excluding high income)Europe & Central Asia (IDA & IBRD countries)European UnionFaroe IslandsFijiFinlandFragile and conflict affected situationsFranceFrench PolynesiaGabonGambia, TheGeorgiaGermanyGhanaGibraltarGreeceGreenlandGrenadaGuatemalaGuineaGuinea-BissauGuyanaHaitiHeavily indebted poor countries (HIPC)High incomeHondurasHong Kong SAR, ChinaHungaryIBRD onlyIcelandIDA & IBRD totalIDA blendIDA onlyIDA totalIndiaIndonesiaIran, Islamic Rep.IraqIrelandIsraelItalyJamaicaJapanJordanKazakhstanKenyaKiribatiKorea, Dem. People’s Rep.Korea, Rep.KuwaitKyrgyz RepublicLao PDRLate-demographic dividendLatin America & Caribbean Latin America & Caribbean (excluding high income)Latin America & the Caribbean (IDA & IBRD countries)LatviaLeast developed countries: UN classificationLebanonLesothoLiberiaLibyaLiechtensteinLithuaniaLow & middle incomeLow incomeLower middle incomeLuxembourgMacao SAR, ChinaMacedonia, FYRMadagascarMalawiMalaysiaMaldivesMaliMaltaMarshall IslandsMauritaniaMauritiusMexicoMicronesia, Fed. Sts.Middle East & North AfricaMiddle East & North Africa (excluding high income)Middle East & North Africa (IDA & IBRD countries)Middle incomeMoldovaMongoliaMontenegroMoroccoMozambiqueMyanmarNamibiaNauruNepalNetherlandsNew CaledoniaNew ZealandNicaraguaNigerNigeriaNorth AmericaNorwayOECD membersOmanOther small statesPacific island small statesPakistanPalauPanamaPapua New GuineaParaguayPeruPhilippinesPolandPortugalPost-demographic dividendPre-demographic dividendQatarRomaniaRussian FederationRwandaSamoaSao Tome and PrincipeSaudi ArabiaSenegalSerbiaSeychellesSierra LeoneSingaporeSint Maarten (Dutch part)Slovak RepublicSloveniaSmall statesSolomon IslandsSomaliaSouth AfricaSouth AsiaSouth Asia (IDA & IBRD)South SudanSpainSri LankaSt. Kitts and NevisSt. LuciaSt. Vincent and the GrenadinesSub-Saharan Africa Sub-Saharan Africa (excluding high income)Sub-Saharan Africa (IDA & IBRD countries)SudanSurinameSwazilandSwedenSwitzerlandSyrian Arab RepublicTajikistanTanzaniaThailandTimor-LesteTogoTongaTrinidad and TobagoTunisiaTurkeyTurkmenistanTurks and Caicos IslandsUgandaUkraineUnited Arab EmiratesUnited KingdomUnited StatesUpper middle incomeUruguayUzbekistanVanuatuVenezuela, RBVietnamWest Bank and GazaWorldYemen, Rep.ZambiaZimbabwe Timeline:
This timeline shows a graph from 1971 to 2014 of Bhutan. No data until 1970. Number of actual observations by date: 44.
Source name:
World Development Indicators
Source organization:
Carbon Dioxide Information Analysis Center, Environmental Sciences Division, Oak Ridge National Laboratory, Tennessee, United States.
Categories, topics:
Climate Change, Environment
Last updated:
apr 23, 2017
Indicators value changes by year
Maximum:
883.747
jan 1, 2014
At the date of observation
Value
Absolute change
Change from previous value
jan 1, 1971
3.667
+3.667
0.0%
jan 1, 1972
3.667
0.0
0.0%
jan 1, 1973
3.667
0.0
0.0%
jan 1, 1974
3.667
0.0
0.0%
jan 1, 1975
3.667
0.0
0.0%
jan 1, 1976
3.667
0.0
0.0%
jan 1, 1977
3.667
0.0
0.0%
jan 1, 1978
7.334
+3.667
100.0%
jan 1, 1979
11.001
+3.667
50.0%
jan 1, 1980
22.002
+11.001
100.0%
jan 1, 1981
22.002
0.0
0.0%
jan 1, 1982
25.669
+3.667
16.67%
jan 1, 1983
33.003
+7.334
28.57%
jan 1, 1984
29.336
-3.667
-11.11%
jan 1, 1985
51.338
+22.002
75.0%
jan 1, 1986
62.339
+11.001
21.43%
jan 1, 1987
55.005
-7.334
-11.76%
jan 1, 1988
102.676
+47.671
86.67%
jan 1, 1989
110.01
+7.334
7.14%
jan 1, 1990
62.339
-47.671
-43.33%
jan 1, 1991
128.345
+66.006
105.88%
jan 1, 1992
187.017
+58.672
45.71%
jan 1, 1993
216.353
+29.336
15.69%
jan 1, 1994
183.35
-33.003
-15.25%
jan 1, 1995
212.686
+29.336
16.0%
jan 1, 1996
249.356
+36.67
17.24%
jan 1, 1997
300.694
+51.338
20.59%
jan 1, 1998
392.369
+91.675
30.49%
jan 1, 1999
381.368
-11.001
-2.8%
jan 1, 2000
385.035
+3.667
0.96%
jan 1, 2001
396.036
+11.001
2.86%
jan 1, 2002
385.035
-11.001
-2.78%
jan 1, 2003
418.038
+33.003
8.57%
jan 1, 2004
377.701
-40.337
-9.65%
jan 1, 2005
308.028
-69.673
-18.45%
jan 1, 2006
396.036
+88.008
28.57%
jan 1, 2007
392.369
-3.667
-0.93%
jan 1, 2008
392.369
0.0
0.0%
jan 1, 2009
421.705
+29.336
7.48%
jan 1, 2010
388.702
-33.003
-7.83%
jan 1, 2011
487.711
+99.009
25.47%
jan 1, 2012
733.4
+245.689
50.38%
jan 1, 2013
817.741
+84.341
11.5%
jan 1, 2014
883.747
+66.006
8.07%
Ranking of countries by current statistics by years


Comments: