29
/
en
AIzaSyAYiBZKx7MnpbEhh9jyipgxe19OcubqV5w
April 1, 2024
217390
Palau
PLW
true
2
1
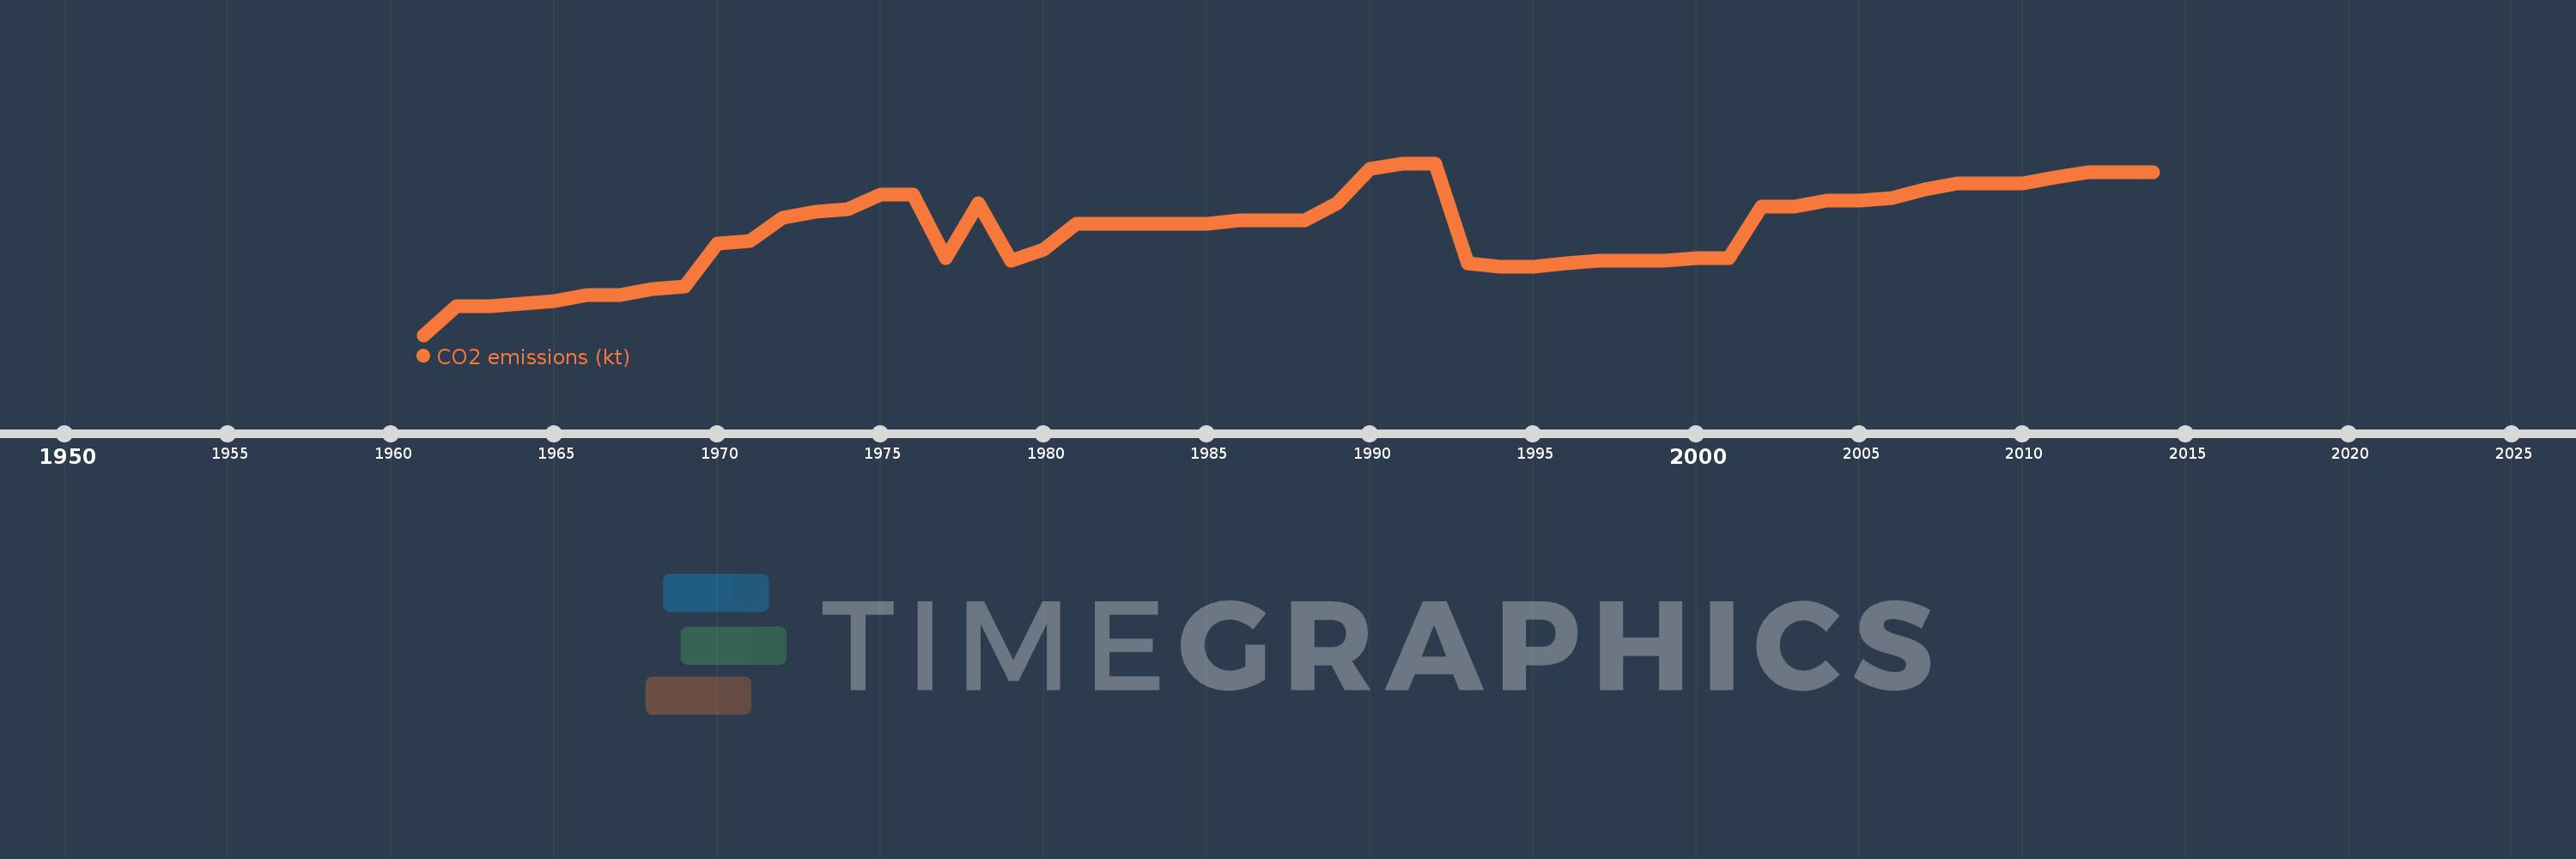
CO2 emissions (kt)
2014,2013,2012,2011,2010,2009,2008,2007,2006,2005,2004,2003,2002,2001,2000,1999,1998,1997,1996,1995,1994,1993,1992,1991,1990,1989,1988,1987,1986,1985,1984,1983,1982,1981,1980,1979,1978,1977,1976,1975,1974,1973,1972,1971,1970,1969,1968,1967,1966,1965,1964,1963,1962,1961
This statistics in other country:
AfghanistanAlbaniaAlgeriaAndorraAngolaAntigua and BarbudaArab WorldArgentinaArmeniaArubaAustraliaAustriaAzerbaijanBahamas, TheBahrainBangladeshBarbadosBelarusBelgiumBelizeBeninBermudaBhutanBoliviaBosnia and HerzegovinaBotswanaBrazilBritish Virgin IslandsBrunei DarussalamBulgariaBurkina FasoBurundiCabo VerdeCambodiaCameroonCanadaCaribbean small statesCayman IslandsCentral African RepublicCentral Europe and the BalticsChadChileChinaColombiaComorosCongo, Dem. Rep.Congo, Rep.Costa RicaCote d'IvoireCroatiaCubaCuracaoCyprusCzech RepublicDenmarkDjiboutiDominicaDominican RepublicEarly-demographic dividendEast Asia & PacificEast Asia & Pacific (excluding high income)East Asia & Pacific (IDA & IBRD countries)EcuadorEgypt, Arab Rep.El SalvadorEquatorial GuineaEritreaEstoniaEthiopiaEuro areaEurope & Central AsiaEurope & Central Asia (excluding high income)Europe & Central Asia (IDA & IBRD countries)European UnionFaroe IslandsFijiFinlandFragile and conflict affected situationsFranceFrench PolynesiaGabonGambia, TheGeorgiaGermanyGhanaGibraltarGreeceGreenlandGrenadaGuatemalaGuineaGuinea-BissauGuyanaHaitiHeavily indebted poor countries (HIPC)High incomeHondurasHong Kong SAR, ChinaHungaryIBRD onlyIcelandIDA & IBRD totalIDA blendIDA onlyIDA totalIndiaIndonesiaIran, Islamic Rep.IraqIrelandIsraelItalyJamaicaJapanJordanKazakhstanKenyaKiribatiKorea, Dem. People’s Rep.Korea, Rep.KuwaitKyrgyz RepublicLao PDRLate-demographic dividendLatin America & Caribbean Latin America & Caribbean (excluding high income)Latin America & the Caribbean (IDA & IBRD countries)LatviaLeast developed countries: UN classificationLebanonLesothoLiberiaLibyaLiechtensteinLithuaniaLow & middle incomeLow incomeLower middle incomeLuxembourgMacao SAR, ChinaMacedonia, FYRMadagascarMalawiMalaysiaMaldivesMaliMaltaMarshall IslandsMauritaniaMauritiusMexicoMicronesia, Fed. Sts.Middle East & North AfricaMiddle East & North Africa (excluding high income)Middle East & North Africa (IDA & IBRD countries)Middle incomeMoldovaMongoliaMontenegroMoroccoMozambiqueMyanmarNamibiaNauruNepalNetherlandsNew CaledoniaNew ZealandNicaraguaNigerNigeriaNorth AmericaNorwayOECD membersOmanOther small statesPacific island small statesPakistanPalauPanamaPapua New GuineaParaguayPeruPhilippinesPolandPortugalPost-demographic dividendPre-demographic dividendQatarRomaniaRussian FederationRwandaSamoaSao Tome and PrincipeSaudi ArabiaSenegalSerbiaSeychellesSierra LeoneSingaporeSint Maarten (Dutch part)Slovak RepublicSloveniaSmall statesSolomon IslandsSomaliaSouth AfricaSouth AsiaSouth Asia (IDA & IBRD)South SudanSpainSri LankaSt. Kitts and NevisSt. LuciaSt. Vincent and the GrenadinesSub-Saharan Africa Sub-Saharan Africa (excluding high income)Sub-Saharan Africa (IDA & IBRD countries)SudanSurinameSwazilandSwedenSwitzerlandSyrian Arab RepublicTajikistanTanzaniaThailandTimor-LesteTogoTongaTrinidad and TobagoTunisiaTurkeyTurkmenistanTurks and Caicos IslandsUgandaUkraineUnited Arab EmiratesUnited KingdomUnited StatesUpper middle incomeUruguayUzbekistanVanuatuVenezuela, RBVietnamWest Bank and GazaWorldYemen, Rep.ZambiaZimbabwe Timeline:
This timeline shows a graph from 1961 to 2014 of Palau. No data until 1960. Number of actual observations by date: 54.
Source name:
World Development Indicators
Source organization:
Carbon Dioxide Information Analysis Center, Environmental Sciences Division, Oak Ridge National Laboratory, Tennessee, United States.
Categories, topics:
Climate Change, Environment
Last updated:
apr 23, 2017
Indicators value changes by year
Minimum:
14.668
jan 1, 1961
Maximum:
234.688
jan 1, 1991
At the date of observation
Value
Absolute change
Change from previous value
jan 1, 1961
14.668
+14.668
0.0%
jan 1, 1962
51.338
+36.67
250.0%
jan 1, 1963
51.338
0.0
0.0%
jan 1, 1964
55.005
+3.667
7.14%
jan 1, 1965
58.672
+3.667
6.67%
jan 1, 1966
66.006
+7.334
12.5%
jan 1, 1967
66.006
0.0
0.0%
jan 1, 1968
73.34
+7.334
11.11%
jan 1, 1969
77.007
+3.667
5.0%
jan 1, 1970
132.012
+55.005
71.43%
jan 1, 1971
135.679
+3.667
2.78%
jan 1, 1972
165.015
+29.336
21.62%
jan 1, 1973
172.349
+7.334
4.44%
jan 1, 1974
176.016
+3.667
2.13%
jan 1, 1975
194.351
+18.335
10.42%
jan 1, 1976
194.351
0.0
0.0%
jan 1, 1977
113.677
-80.674
-41.51%
jan 1, 1978
183.35
+69.673
61.29%
jan 1, 1979
110.01
-73.34
-40.0%
jan 1, 1980
124.678
+14.668
13.33%
jan 1, 1981
157.681
+33.003
26.47%
jan 1, 1982
157.681
0.0
0.0%
jan 1, 1983
157.681
0.0
0.0%
jan 1, 1984
157.681
0.0
0.0%
jan 1, 1985
157.681
0.0
0.0%
jan 1, 1986
161.348
+3.667
2.33%
jan 1, 1987
161.348
0.0
0.0%
jan 1, 1988
161.348
0.0
0.0%
jan 1, 1989
183.35
+22.002
13.64%
jan 1, 1990
227.354
+44.004
24.0%
jan 1, 1991
234.688
+7.334
3.23%
jan 1, 1992
234.688
0.0
0.0%
jan 1, 1993
106.343
-128.345
-54.69%
jan 1, 1994
102.676
-3.667
-3.45%
jan 1, 1995
102.676
0.0
0.0%
jan 1, 1996
106.343
+3.667
3.57%
jan 1, 1997
110.01
+3.667
3.45%
jan 1, 1998
110.01
0.0
0.0%
jan 1, 1999
110.01
0.0
0.0%
jan 1, 2000
113.677
+3.667
3.33%
jan 1, 2001
113.677
0.0
0.0%
jan 1, 2002
179.683
+66.006
58.06%
jan 1, 2003
179.683
0.0
0.0%
jan 1, 2004
187.017
+7.334
4.08%
jan 1, 2005
187.017
0.0
0.0%
jan 1, 2006
190.684
+3.667
1.96%
jan 1, 2007
201.685
+11.001
5.77%
jan 1, 2008
209.019
+7.334
3.64%
jan 1, 2009
209.019
0.0
0.0%
jan 1, 2010
209.019
0.0
0.0%
jan 1, 2011
216.353
+7.334
3.51%
jan 1, 2012
223.687
+7.334
3.39%
jan 1, 2013
223.687
0.0
0.0%
jan 1, 2014
223.687
0.0
0.0%
Ranking of countries by current statistics by years


Comments: