29
/
en
AIzaSyAYiBZKx7MnpbEhh9jyipgxe19OcubqV5w
April 1, 2024
38799
IDA only
IDX
false
2
1
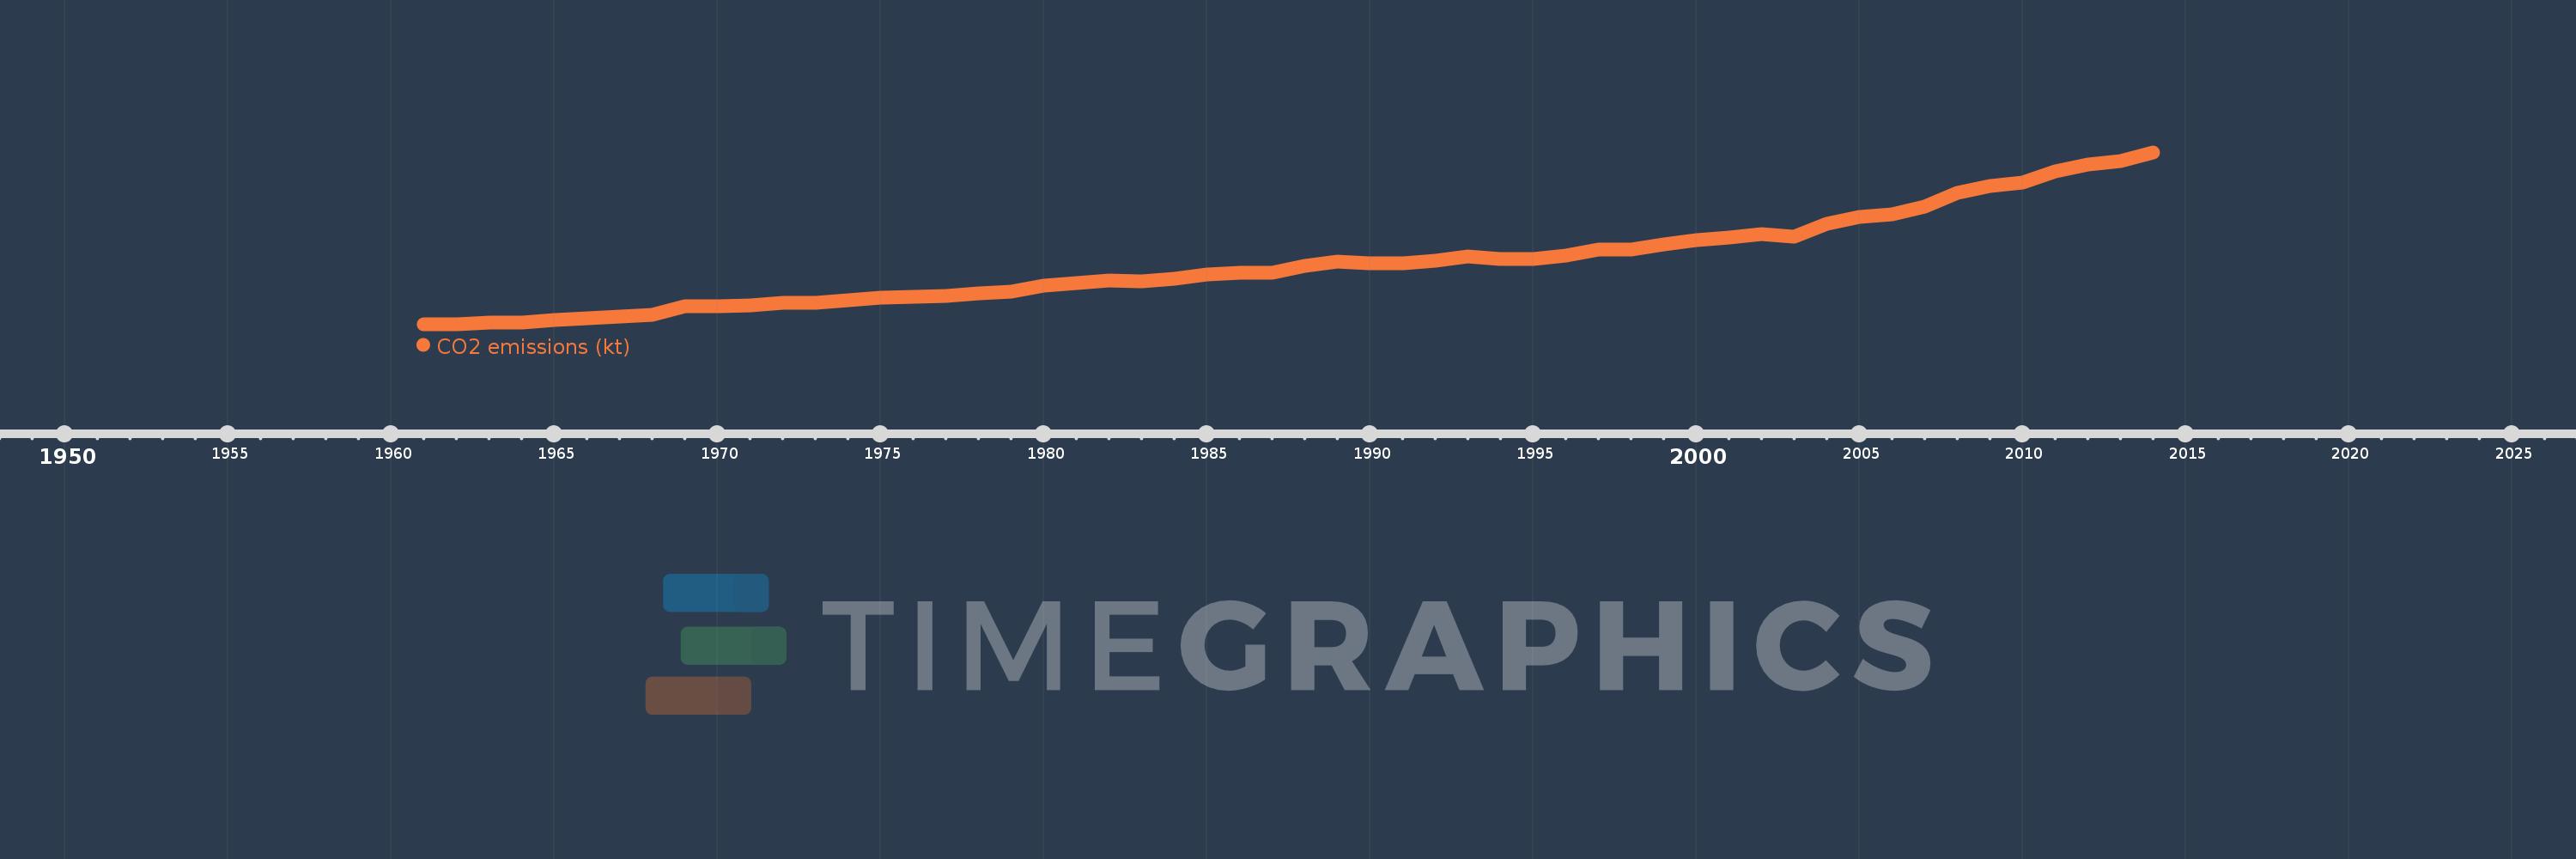
CO2 emissions (kt)
2014,2013,2012,2011,2010,2009,2008,2007,2006,2005,2004,2003,2002,2001,2000,1999,1998,1997,1996,1995,1994,1993,1992,1991,1990,1989,1988,1987,1986,1985,1984,1983,1982,1981,1980,1979,1978,1977,1976,1975,1974,1973,1972,1971,1970,1969,1968,1967,1966,1965,1964,1963,1962,1961
This statistics in other country:
AfghanistanAlbaniaAlgeriaAndorraAngolaAntigua and BarbudaArab WorldArgentinaArmeniaArubaAustraliaAustriaAzerbaijanBahamas, TheBahrainBangladeshBarbadosBelarusBelgiumBelizeBeninBermudaBhutanBoliviaBosnia and HerzegovinaBotswanaBrazilBritish Virgin IslandsBrunei DarussalamBulgariaBurkina FasoBurundiCabo VerdeCambodiaCameroonCanadaCaribbean small statesCayman IslandsCentral African RepublicCentral Europe and the BalticsChadChileChinaColombiaComorosCongo, Dem. Rep.Congo, Rep.Costa RicaCote d'IvoireCroatiaCubaCuracaoCyprusCzech RepublicDenmarkDjiboutiDominicaDominican RepublicEarly-demographic dividendEast Asia & PacificEast Asia & Pacific (excluding high income)East Asia & Pacific (IDA & IBRD countries)EcuadorEgypt, Arab Rep.El SalvadorEquatorial GuineaEritreaEstoniaEthiopiaEuro areaEurope & Central AsiaEurope & Central Asia (excluding high income)Europe & Central Asia (IDA & IBRD countries)European UnionFaroe IslandsFijiFinlandFragile and conflict affected situationsFranceFrench PolynesiaGabonGambia, TheGeorgiaGermanyGhanaGibraltarGreeceGreenlandGrenadaGuatemalaGuineaGuinea-BissauGuyanaHaitiHeavily indebted poor countries (HIPC)High incomeHondurasHong Kong SAR, ChinaHungaryIBRD onlyIcelandIDA & IBRD totalIDA blendIDA onlyIDA totalIndiaIndonesiaIran, Islamic Rep.IraqIrelandIsraelItalyJamaicaJapanJordanKazakhstanKenyaKiribatiKorea, Dem. People’s Rep.Korea, Rep.KuwaitKyrgyz RepublicLao PDRLate-demographic dividendLatin America & Caribbean Latin America & Caribbean (excluding high income)Latin America & the Caribbean (IDA & IBRD countries)LatviaLeast developed countries: UN classificationLebanonLesothoLiberiaLibyaLiechtensteinLithuaniaLow & middle incomeLow incomeLower middle incomeLuxembourgMacao SAR, ChinaMacedonia, FYRMadagascarMalawiMalaysiaMaldivesMaliMaltaMarshall IslandsMauritaniaMauritiusMexicoMicronesia, Fed. Sts.Middle East & North AfricaMiddle East & North Africa (excluding high income)Middle East & North Africa (IDA & IBRD countries)Middle incomeMoldovaMongoliaMontenegroMoroccoMozambiqueMyanmarNamibiaNauruNepalNetherlandsNew CaledoniaNew ZealandNicaraguaNigerNigeriaNorth AmericaNorwayOECD membersOmanOther small statesPacific island small statesPakistanPalauPanamaPapua New GuineaParaguayPeruPhilippinesPolandPortugalPost-demographic dividendPre-demographic dividendQatarRomaniaRussian FederationRwandaSamoaSao Tome and PrincipeSaudi ArabiaSenegalSerbiaSeychellesSierra LeoneSingaporeSint Maarten (Dutch part)Slovak RepublicSloveniaSmall statesSolomon IslandsSomaliaSouth AfricaSouth AsiaSouth Asia (IDA & IBRD)South SudanSpainSri LankaSt. Kitts and NevisSt. LuciaSt. Vincent and the GrenadinesSub-Saharan Africa Sub-Saharan Africa (excluding high income)Sub-Saharan Africa (IDA & IBRD countries)SudanSurinameSwazilandSwedenSwitzerlandSyrian Arab RepublicTajikistanTanzaniaThailandTimor-LesteTogoTongaTrinidad and TobagoTunisiaTurkeyTurkmenistanTurks and Caicos IslandsUgandaUkraineUnited Arab EmiratesUnited KingdomUnited StatesUpper middle incomeUruguayUzbekistanVanuatuVenezuela, RBVietnamWest Bank and GazaWorldYemen, Rep.ZambiaZimbabwe Timeline:
This timeline shows a graph from 1961 to 2014 of IDA only. No data until 1960. Number of actual observations by date: 54.
Source name:
World Development Indicators
Source organization:
Carbon Dioxide Information Analysis Center, Environmental Sciences Division, Oak Ridge National Laboratory, Tennessee, United States.
Categories, topics:
Climate Change, Environment
Last updated:
apr 23, 2017
Indicators value changes by year
Minimum:
37.578K
jan 1, 1962
Maximum:
351.187K
jan 1, 2014
At the date of observation
Value
Absolute change
Change from previous value
jan 1, 1961
38.123K
+38.123K
0.0%
jan 1, 1962
37.578K
-544.972
-1.43%
jan 1, 1963
40.246K
+2.668K
7.1%
jan 1, 1964
40.845K
+599.09
1.49%
jan 1, 1965
45.038K
+4.194K
10.27%
jan 1, 1966
49.074K
+4.035K
8.96%
jan 1, 1967
51.77K
+2.696K
5.49%
jan 1, 1968
54.759K
+2.989K
5.77%
jan 1, 1969
70.48K
+15.721K
28.71%
jan 1, 1970
70.087K
-393.029
-0.56%
jan 1, 1971
72.363K
+2.276K
3.25%
jan 1, 1972
77.376K
+5.013K
6.93%
jan 1, 1973
76.188K
-1.188K
-1.54%
jan 1, 1974
81.858K
+5.67K
7.44%
jan 1, 1975
85.704K
+3.846K
4.7%
jan 1, 1976
87.126K
+1.422K
1.66%
jan 1, 1977
88.984K
+1.858K
2.13%
jan 1, 1978
94.369K
+5.385K
6.05%
jan 1, 1979
97.234K
+2.865K
3.04%
jan 1, 1980
108.318K
+11.085K
11.4%
jan 1, 1981
112.502K
+4.183K
3.86%
jan 1, 1982
117.986K
+5.484K
4.87%
jan 1, 1983
115.972K
-2.014K
-1.71%
jan 1, 1984
120.877K
+4.905K
4.23%
jan 1, 1985
128.591K
+7.714K
6.38%
jan 1, 1986
130.92K
+2.329K
1.81%
jan 1, 1987
131.996K
+1.076K
0.82%
jan 1, 1988
144.714K
+12.718K
9.64%
jan 1, 1989
152.363K
+7.649K
5.29%
jan 1, 1990
148.102K
-4.261K
-2.8%
jan 1, 1991
149.416K
+1.314K
0.89%
jan 1, 1992
153.878K
+4.462K
2.99%
jan 1, 1993
161.244K
+7.365K
4.79%
jan 1, 1994
155.982K
-5.261K
-3.26%
jan 1, 1995
157.243K
+1.26K
0.81%
jan 1, 1996
162.334K
+5.091K
3.24%
jan 1, 1997
174.539K
+12.205K
7.52%
jan 1, 1998
174.562K
+22.714
0.01%
jan 1, 1999
183.772K
+9.21K
5.28%
jan 1, 2000
191.011K
+7.239K
3.94%
jan 1, 2001
195.585K
+4.575K
2.4%
jan 1, 2002
202.578K
+6.993K
3.58%
jan 1, 2003
196.917K
-5.66K
-2.79%
jan 1, 2004
220.42K
+23.502K
11.94%
jan 1, 2005
233.186K
+12.766K
5.79%
jan 1, 2006
237.605K
+4.419K
1.9%
jan 1, 2007
252.506K
+14.901K
6.27%
jan 1, 2008
276.563K
+24.056K
9.53%
jan 1, 2009
290.609K
+14.046K
5.08%
jan 1, 2010
295.77K
+5.161K
1.78%
jan 1, 2011
317.159K
+21.39K
7.23%
jan 1, 2012
328.569K
+11.409K
3.6%
jan 1, 2013
335.871K
+7.302K
2.22%
jan 1, 2014
351.187K
+15.315K
4.56%
Ranking of countries by current statistics by years


Comments: