29
/
en
AIzaSyAYiBZKx7MnpbEhh9jyipgxe19OcubqV5w
April 1, 2024
40543
Late-demographic dividend
LTE
false
2
1
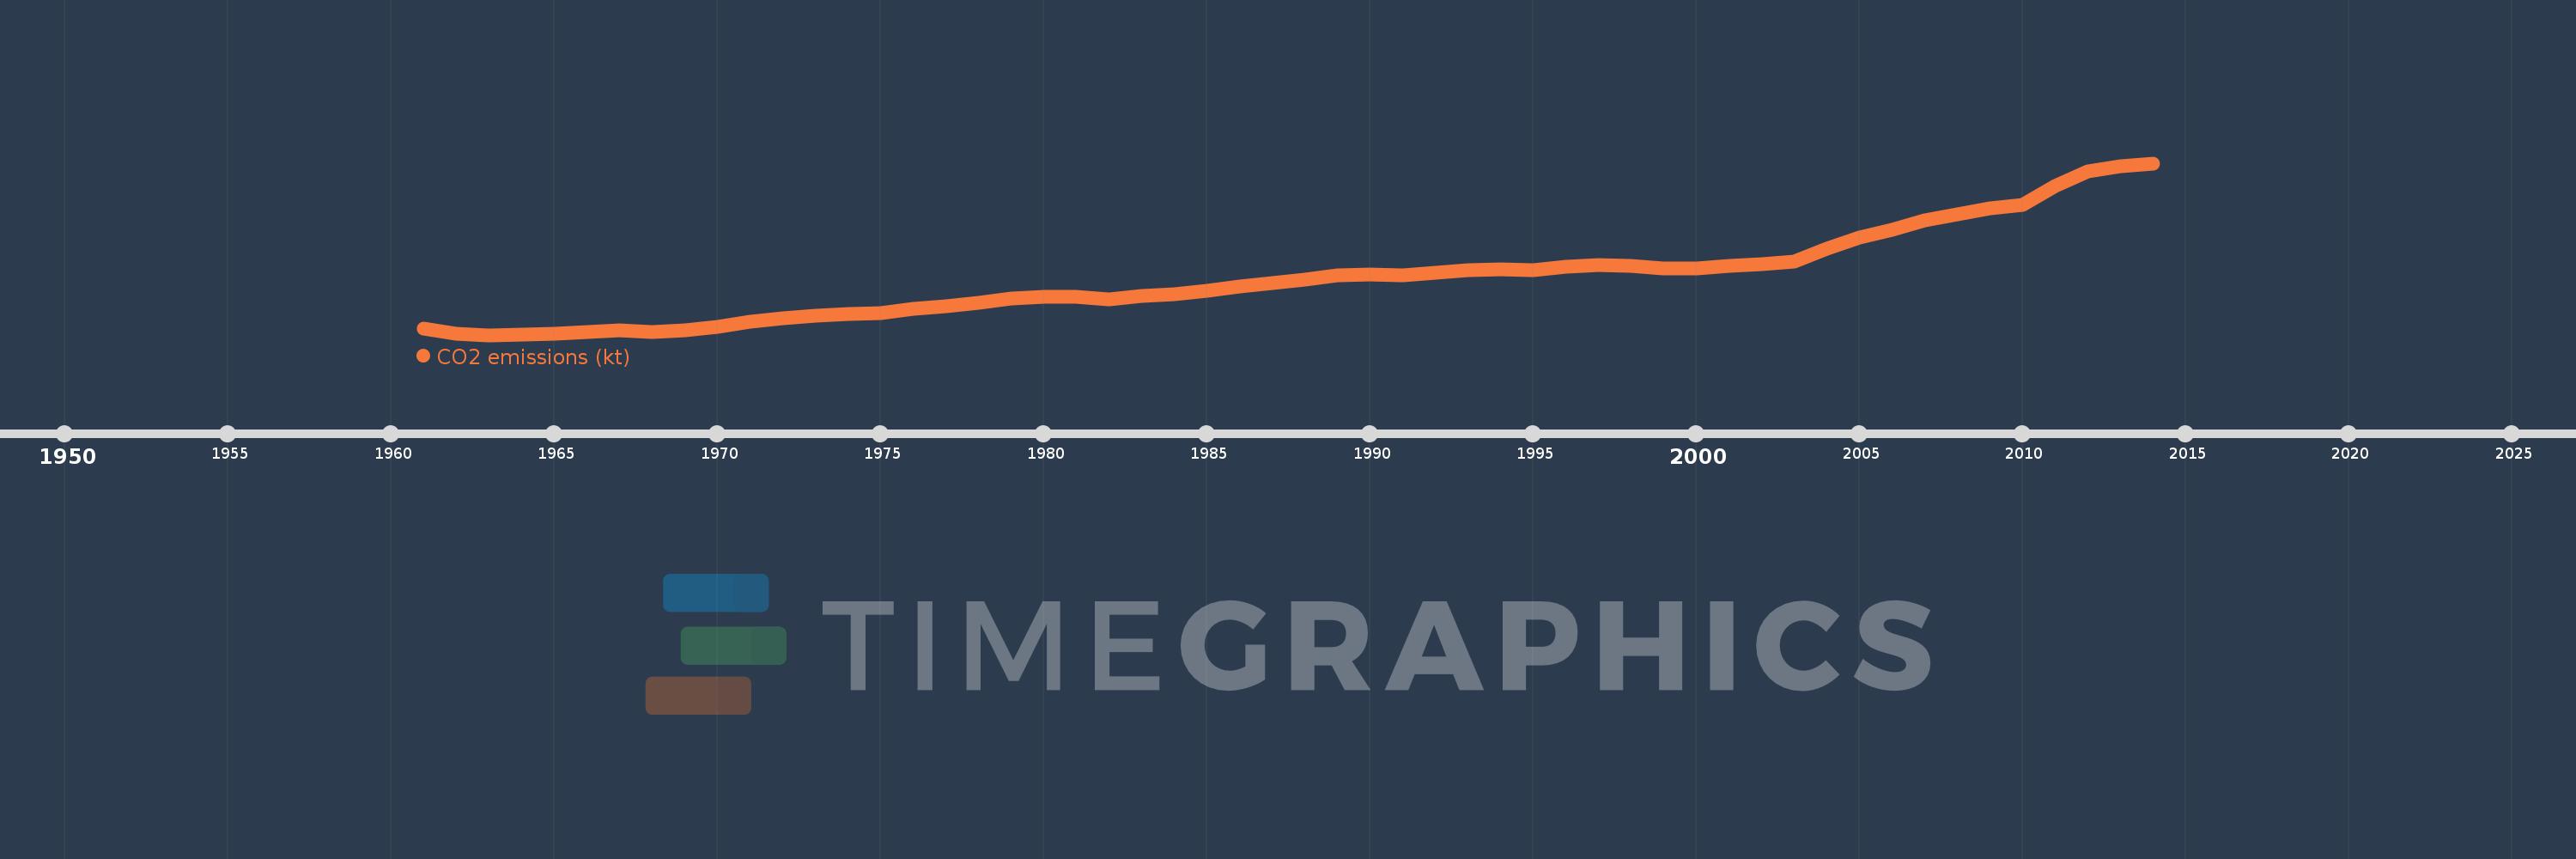
CO2 emissions (kt)
2014,2013,2012,2011,2010,2009,2008,2007,2006,2005,2004,2003,2002,2001,2000,1999,1998,1997,1996,1995,1994,1993,1992,1991,1990,1989,1988,1987,1986,1985,1984,1983,1982,1981,1980,1979,1978,1977,1976,1975,1974,1973,1972,1971,1970,1969,1968,1967,1966,1965,1964,1963,1962,1961
This statistics in other country:
AfghanistanAlbaniaAlgeriaAndorraAngolaAntigua and BarbudaArab WorldArgentinaArmeniaArubaAustraliaAustriaAzerbaijanBahamas, TheBahrainBangladeshBarbadosBelarusBelgiumBelizeBeninBermudaBhutanBoliviaBosnia and HerzegovinaBotswanaBrazilBritish Virgin IslandsBrunei DarussalamBulgariaBurkina FasoBurundiCabo VerdeCambodiaCameroonCanadaCaribbean small statesCayman IslandsCentral African RepublicCentral Europe and the BalticsChadChileChinaColombiaComorosCongo, Dem. Rep.Congo, Rep.Costa RicaCote d'IvoireCroatiaCubaCuracaoCyprusCzech RepublicDenmarkDjiboutiDominicaDominican RepublicEarly-demographic dividendEast Asia & PacificEast Asia & Pacific (excluding high income)East Asia & Pacific (IDA & IBRD countries)EcuadorEgypt, Arab Rep.El SalvadorEquatorial GuineaEritreaEstoniaEthiopiaEuro areaEurope & Central AsiaEurope & Central Asia (excluding high income)Europe & Central Asia (IDA & IBRD countries)European UnionFaroe IslandsFijiFinlandFragile and conflict affected situationsFranceFrench PolynesiaGabonGambia, TheGeorgiaGermanyGhanaGibraltarGreeceGreenlandGrenadaGuatemalaGuineaGuinea-BissauGuyanaHaitiHeavily indebted poor countries (HIPC)High incomeHondurasHong Kong SAR, ChinaHungaryIBRD onlyIcelandIDA & IBRD totalIDA blendIDA onlyIDA totalIndiaIndonesiaIran, Islamic Rep.IraqIrelandIsraelItalyJamaicaJapanJordanKazakhstanKenyaKiribatiKorea, Dem. People’s Rep.Korea, Rep.KuwaitKyrgyz RepublicLao PDRLate-demographic dividendLatin America & Caribbean Latin America & Caribbean (excluding high income)Latin America & the Caribbean (IDA & IBRD countries)LatviaLeast developed countries: UN classificationLebanonLesothoLiberiaLibyaLiechtensteinLithuaniaLow & middle incomeLow incomeLower middle incomeLuxembourgMacao SAR, ChinaMacedonia, FYRMadagascarMalawiMalaysiaMaldivesMaliMaltaMarshall IslandsMauritaniaMauritiusMexicoMicronesia, Fed. Sts.Middle East & North AfricaMiddle East & North Africa (excluding high income)Middle East & North Africa (IDA & IBRD countries)Middle incomeMoldovaMongoliaMontenegroMoroccoMozambiqueMyanmarNamibiaNauruNepalNetherlandsNew CaledoniaNew ZealandNicaraguaNigerNigeriaNorth AmericaNorwayOECD membersOmanOther small statesPacific island small statesPakistanPalauPanamaPapua New GuineaParaguayPeruPhilippinesPolandPortugalPost-demographic dividendPre-demographic dividendQatarRomaniaRussian FederationRwandaSamoaSao Tome and PrincipeSaudi ArabiaSenegalSerbiaSeychellesSierra LeoneSingaporeSint Maarten (Dutch part)Slovak RepublicSloveniaSmall statesSolomon IslandsSomaliaSouth AfricaSouth AsiaSouth Asia (IDA & IBRD)South SudanSpainSri LankaSt. Kitts and NevisSt. LuciaSt. Vincent and the GrenadinesSub-Saharan Africa Sub-Saharan Africa (excluding high income)Sub-Saharan Africa (IDA & IBRD countries)SudanSurinameSwazilandSwedenSwitzerlandSyrian Arab RepublicTajikistanTanzaniaThailandTimor-LesteTogoTongaTrinidad and TobagoTunisiaTurkeyTurkmenistanTurks and Caicos IslandsUgandaUkraineUnited Arab EmiratesUnited KingdomUnited StatesUpper middle incomeUruguayUzbekistanVanuatuVenezuela, RBVietnamWest Bank and GazaWorldYemen, Rep.ZambiaZimbabwe Timeline:
This timeline shows a graph from 1961 to 2014 of Late-demographic dividend. No data until 1960. Number of actual observations by date: 54.
Source name:
World Development Indicators
Source organization:
Carbon Dioxide Information Analysis Center, Environmental Sciences Division, Oak Ridge National Laboratory, Tennessee, United States.
Categories, topics:
Climate Change, Environment
Last updated:
apr 23, 2017
Indicators value changes by year
Minimum:
1.499 mln
jan 1, 1963
Maximum:
15.079 mln
jan 1, 2014
At the date of observation
Value
Absolute change
Change from previous value
jan 1, 1961
1.976 mln
+1.976 mln
0.0%
jan 1, 1962
1.627 mln
-348.398K
-17.64%
jan 1, 1963
1.499 mln
-128.019K
-7.87%
jan 1, 1964
1.542 mln
+42.89K
2.86%
jan 1, 1965
1.605 mln
+63.451K
4.11%
jan 1, 1966
1.714 mln
+108.684K
6.77%
jan 1, 1967
1.847 mln
+133.046K
7.76%
jan 1, 1968
1.729 mln
-118.282K
-6.4%
jan 1, 1969
1.869 mln
+139.835K
8.09%
jan 1, 1970
2.166 mln
+297.193K
15.9%
jan 1, 1971
2.569 mln
+403.266K
18.62%
jan 1, 1972
2.832 mln
+262.305K
10.21%
jan 1, 1973
3.006 mln
+174.616K
6.17%
jan 1, 1974
3.166 mln
+160.325K
5.33%
jan 1, 1975
3.226 mln
+59.628K
1.88%
jan 1, 1976
3.572 mln
+345.72K
10.72%
jan 1, 1977
3.755 mln
+183.632K
5.14%
jan 1, 1978
4.017 mln
+261.329K
6.96%
jan 1, 1979
4.376 mln
+358.826K
8.93%
jan 1, 1980
4.493 mln
+117.291K
2.68%
jan 1, 1981
4.494 mln
+1.4K
0.03%
jan 1, 1982
4.339 mln
-154.963K
-3.45%
jan 1, 1983
4.559 mln
+219.523K
5.06%
jan 1, 1984
4.734 mln
+174.862K
3.84%
jan 1, 1985
5.013 mln
+278.992K
5.89%
jan 1, 1986
5.351 mln
+338.147K
6.75%
jan 1, 1987
5.6 mln
+248.831K
4.65%
jan 1, 1988
5.911 mln
+311.163K
5.56%
jan 1, 1989
6.187 mln
+276.521K
4.68%
jan 1, 1990
6.29 mln
+102.669K
1.66%
jan 1, 1991
6.245 mln
-45.218K
-0.72%
jan 1, 1992
6.426 mln
+180.945K
2.9%
jan 1, 1993
6.656 mln
+229.97K
3.58%
jan 1, 1994
6.688 mln
+32.583K
0.49%
jan 1, 1995
6.617 mln
-71.144K
-1.06%
jan 1, 1996
6.878 mln
+260.33K
3.93%
jan 1, 1997
7.027 mln
+149.432K
2.17%
jan 1, 1998
6.962 mln
-64.482K
-0.92%
jan 1, 1999
6.769 mln
-193.371K
-2.78%
jan 1, 2000
6.779 mln
+9.461K
0.14%
jan 1, 2001
6.963 mln
+184.019K
2.71%
jan 1, 2002
7.115 mln
+152.461K
2.19%
jan 1, 2003
7.326 mln
+210.524K
2.96%
jan 1, 2004
8.318 mln
+992.069K
13.54%
jan 1, 2005
9.195 mln
+877.146K
10.55%
jan 1, 2006
9.787 mln
+592.413K
6.44%
jan 1, 2007
10.582 mln
+795.064K
8.12%
jan 1, 2008
11.031 mln
+448.612K
4.24%
jan 1, 2009
11.536 mln
+505.306K
4.58%
jan 1, 2010
11.791 mln
+255.055K
2.21%
jan 1, 2011
13.285 mln
+1.494 mln
12.67%
jan 1, 2012
14.412 mln
+1.126 mln
8.48%
jan 1, 2013
14.837 mln
+425.738K
2.95%
jan 1, 2014
15.079 mln
+241.972K
1.63%
Ranking of countries by current statistics by years


Comments: