29
/
en
AIzaSyAYiBZKx7MnpbEhh9jyipgxe19OcubqV5w
April 1, 2024
35412
Heavily indebted poor countries (HIPC)
HPC
false
2
1
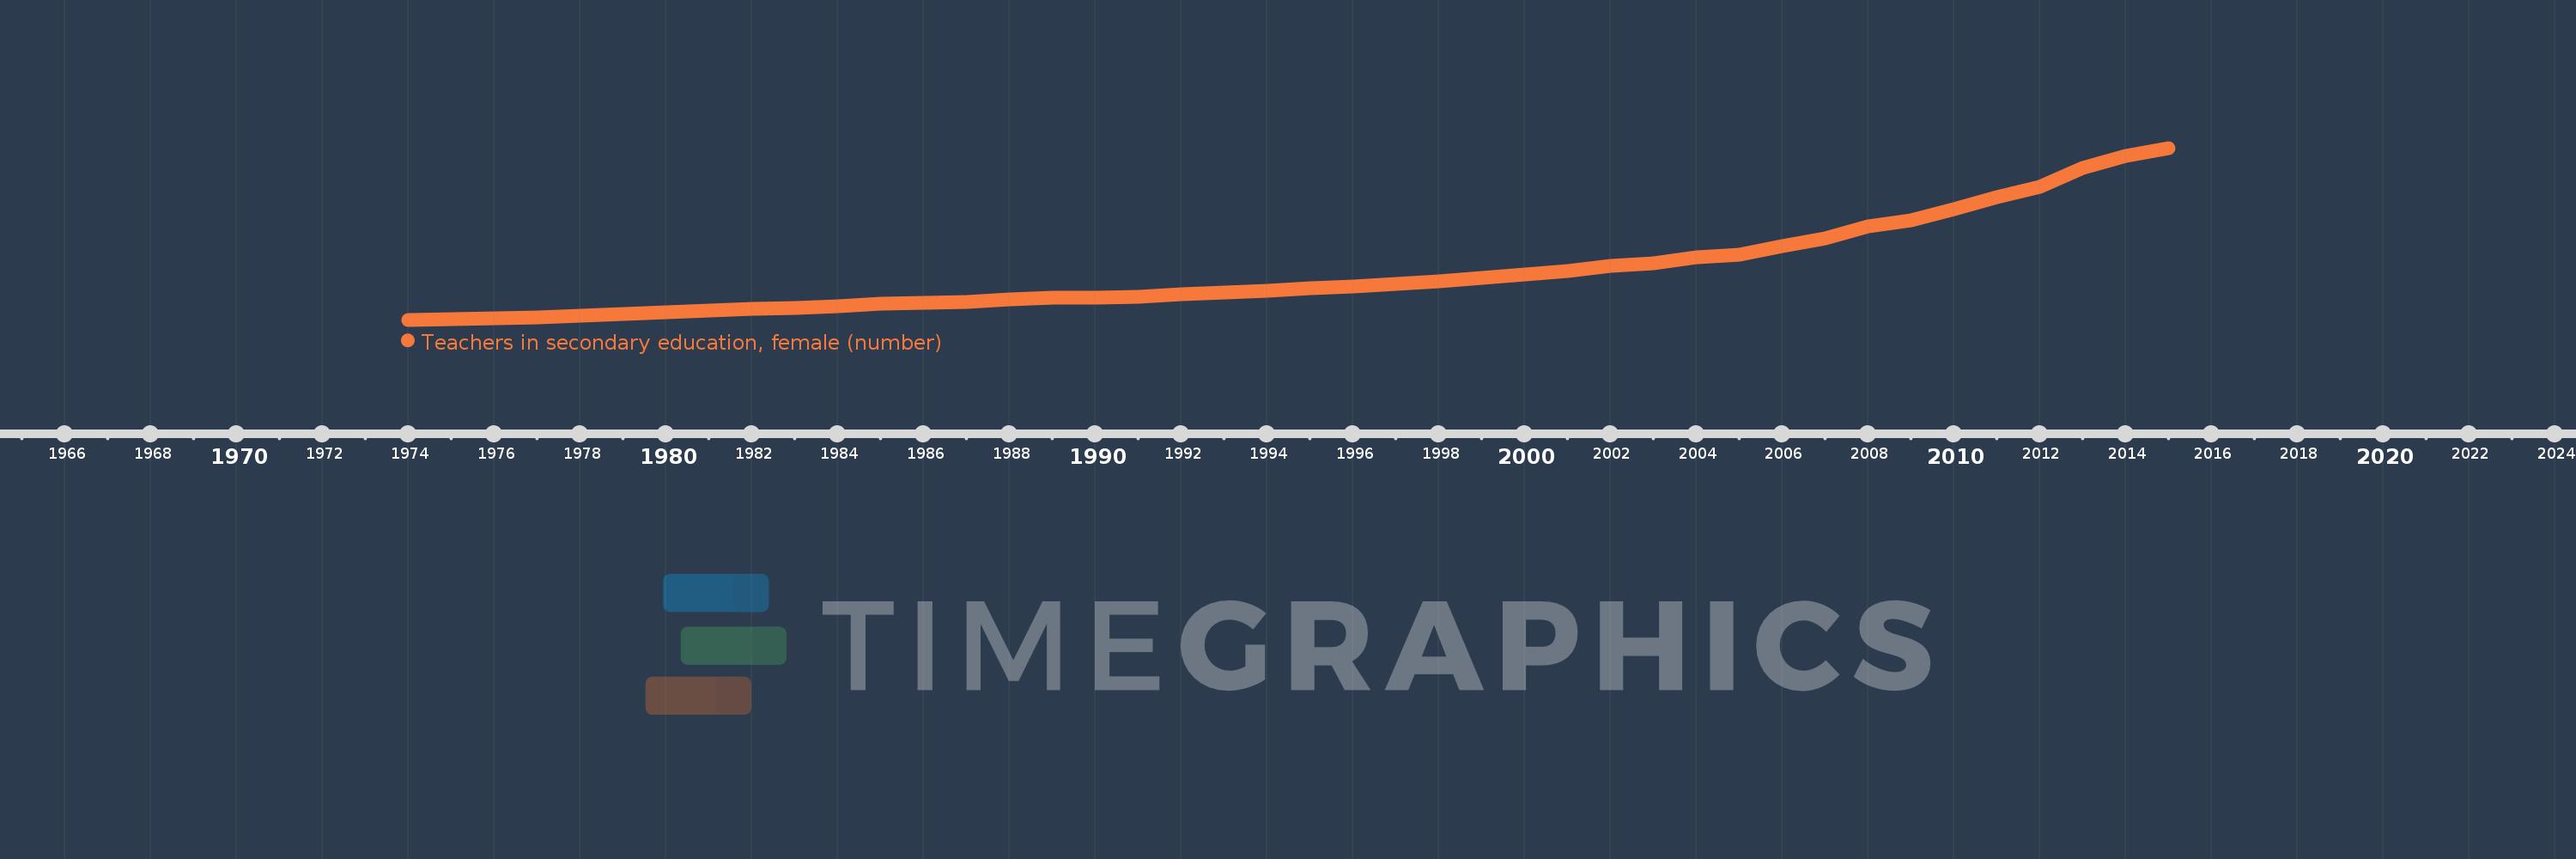
Teachers in secondary education, female (number)
2015,2014,2013,2012,2011,2010,2009,2008,2007,2006,2005,2004,2003,2002,2001,2000,1999,1998,1997,1996,1995,1994,1993,1992,1991,1990,1989,1988,1987,1986,1985,1984,1983,1982,1981,1980,1979,1978,1977,1976,1975,1974
This statistics in other country:
AfghanistanAlbaniaAlgeriaAmerican SamoaAndorraAngolaAntigua and BarbudaArab WorldArgentinaArmeniaArubaAustraliaAustriaBahamas, TheBahrainBangladeshBarbadosBelarusBelgiumBelizeBeninBermudaBhutanBoliviaBosnia and HerzegovinaBotswanaBrazilBritish Virgin IslandsBrunei DarussalamBulgariaBurkina FasoBurundiCabo VerdeCambodiaCameroonCanadaCaribbean small statesCayman IslandsCentral African RepublicCentral Europe and the BalticsChadChileChinaColombiaComorosCongo, Dem. Rep.Congo, Rep.Costa RicaCote d'IvoireCroatiaCubaCyprusCzech RepublicDenmarkDjiboutiDominicaDominican RepublicEarly-demographic dividendEast Asia & PacificEast Asia & Pacific (excluding high income)East Asia & Pacific (IDA & IBRD countries)EcuadorEgypt, Arab Rep.El SalvadorEquatorial GuineaEritreaEstoniaEthiopiaEuro areaEurope & Central AsiaEurope & Central Asia (excluding high income)Europe & Central Asia (IDA & IBRD countries)European UnionFijiFinlandFragile and conflict affected situationsFranceFrench PolynesiaGabonGambia, TheGeorgiaGermanyGhanaGibraltarGreeceGrenadaGuamGuatemalaGuineaGuinea-BissauGuyanaHeavily indebted poor countries (HIPC)High incomeHondurasHong Kong SAR, ChinaHungaryIBRD onlyIcelandIDA & IBRD totalIDA blendIDA onlyIDA totalIndiaIndonesiaIran, Islamic Rep.IraqIrelandIsraelItalyJamaicaJapanJordanKazakhstanKenyaKiribatiKorea, Dem. People’s Rep.Korea, Rep.KuwaitKyrgyz RepublicLao PDRLate-demographic dividendLatin America & Caribbean Latin America & Caribbean (excluding high income)Latin America & the Caribbean (IDA & IBRD countries)LatviaLeast developed countries: UN classificationLebanonLesothoLiberiaLibyaLiechtensteinLithuaniaLow & middle incomeLow incomeLower middle incomeLuxembourgMacao SAR, ChinaMacedonia, FYRMadagascarMalawiMalaysiaMaldivesMaliMaltaMarshall IslandsMauritaniaMauritiusMexicoMiddle East & North AfricaMiddle East & North Africa (excluding high income)Middle East & North Africa (IDA & IBRD countries)Middle incomeMoldovaMonacoMongoliaMoroccoMozambiqueMyanmarNamibiaNauruNepalNetherlandsNew CaledoniaNew ZealandNicaraguaNigerNigeriaNorth AmericaNorwayOECD membersOmanOther small statesPacific island small statesPakistanPalauPanamaPapua New GuineaParaguayPeruPhilippinesPolandPortugalPost-demographic dividendPre-demographic dividendPuerto RicoQatarRomaniaRussian FederationRwandaSamoaSan MarinoSao Tome and PrincipeSaudi ArabiaSenegalSerbiaSeychellesSierra LeoneSingaporeSint Maarten (Dutch part)Slovak RepublicSloveniaSmall statesSolomon IslandsSomaliaSouth AfricaSouth AsiaSouth Asia (IDA & IBRD)SpainSri LankaSt. Kitts and NevisSt. LuciaSt. Vincent and the GrenadinesSub-Saharan Africa Sub-Saharan Africa (excluding high income)Sub-Saharan Africa (IDA & IBRD countries)SudanSurinameSwazilandSwedenSwitzerlandSyrian Arab RepublicTajikistanTanzaniaThailandTimor-LesteTogoTongaTrinidad and TobagoTunisiaTurkeyTurks and Caicos IslandsUgandaUkraineUnited Arab EmiratesUnited KingdomUnited StatesUpper middle incomeUruguayUzbekistanVanuatuVenezuela, RBVietnamVirgin Islands (U.S.)West Bank and GazaWorldYemen, Rep.ZambiaZimbabwe Timeline:
This timeline shows a graph from 1974 to 2015 of Heavily indebted poor countries (HIPC). No data until 1973. Number of actual observations by date: 42.
Source name:
World Development Indicators
Source organization:
UNESCO Institute for Statistics
Categories, topics:
Education
Last updated:
apr 23, 2017
Indicators value changes by year
Minimum:
46.531K
jan 1, 1974
Maximum:
417.536K
jan 1, 2015
At the date of observation
Value
Absolute change
Change from previous value
jan 1, 1974
46.531K
+46.531K
0.0%
jan 1, 1975
47.48K
+949.535
2.04%
jan 1, 1976
49.596K
+2.116K
4.46%
jan 1, 1977
52.042K
+2.446K
4.93%
jan 1, 1978
55.968K
+3.926K
7.54%
jan 1, 1979
58.298K
+2.33K
4.16%
jan 1, 1980
61.837K
+3.539K
6.07%
jan 1, 1981
65.555K
+3.717K
6.01%
jan 1, 1982
69.722K
+4.167K
6.36%
jan 1, 1983
72.375K
+2.653K
3.81%
jan 1, 1984
76.143K
+3.768K
5.21%
jan 1, 1985
80.856K
+4.713K
6.19%
jan 1, 1986
82.994K
+2.138K
2.64%
jan 1, 1987
85.271K
+2.277K
2.74%
jan 1, 1988
90.07K
+4.8K
5.63%
jan 1, 1989
93.307K
+3.237K
3.59%
jan 1, 1990
94.755K
+1.447K
1.55%
jan 1, 1991
96.35K
+1.595K
1.68%
jan 1, 1992
101.18K
+4.83K
5.01%
jan 1, 1993
104.987K
+3.807K
3.76%
jan 1, 1994
109.362K
+4.376K
4.17%
jan 1, 1995
114.174K
+4.811K
4.4%
jan 1, 1996
118.015K
+3.841K
3.36%
jan 1, 1997
123.596K
+5.581K
4.73%
jan 1, 1998
128.977K
+5.381K
4.35%
jan 1, 1999
136.096K
+7.119K
5.52%
jan 1, 2000
144.112K
+8.017K
5.89%
jan 1, 2001
152.615K
+8.502K
5.9%
jan 1, 2002
162.101K
+9.487K
6.22%
jan 1, 2003
169.268K
+7.166K
4.42%
jan 1, 2004
181.961K
+12.694K
7.5%
jan 1, 2005
186.309K
+4.348K
2.39%
jan 1, 2006
206.152K
+19.842K
10.65%
jan 1, 2007
222.278K
+16.126K
7.82%
jan 1, 2008
248.757K
+26.479K
11.91%
jan 1, 2009
261.546K
+12.79K
5.14%
jan 1, 2010
284.96K
+23.414K
8.95%
jan 1, 2011
311.749K
+26.789K
9.4%
jan 1, 2012
334.268K
+22.519K
7.22%
jan 1, 2013
373.901K
+39.633K
11.86%
jan 1, 2014
401.103K
+27.202K
7.28%
jan 1, 2015
417.536K
+16.433K
4.1%
Ranking of countries by current statistics by years


Comments: