30
/
AIzaSyAYiBZKx7MnpbEhh9jyipgxe19OcubqV5w
April 1, 2024
275274
United Arab Emirates
ARE
true
2
1
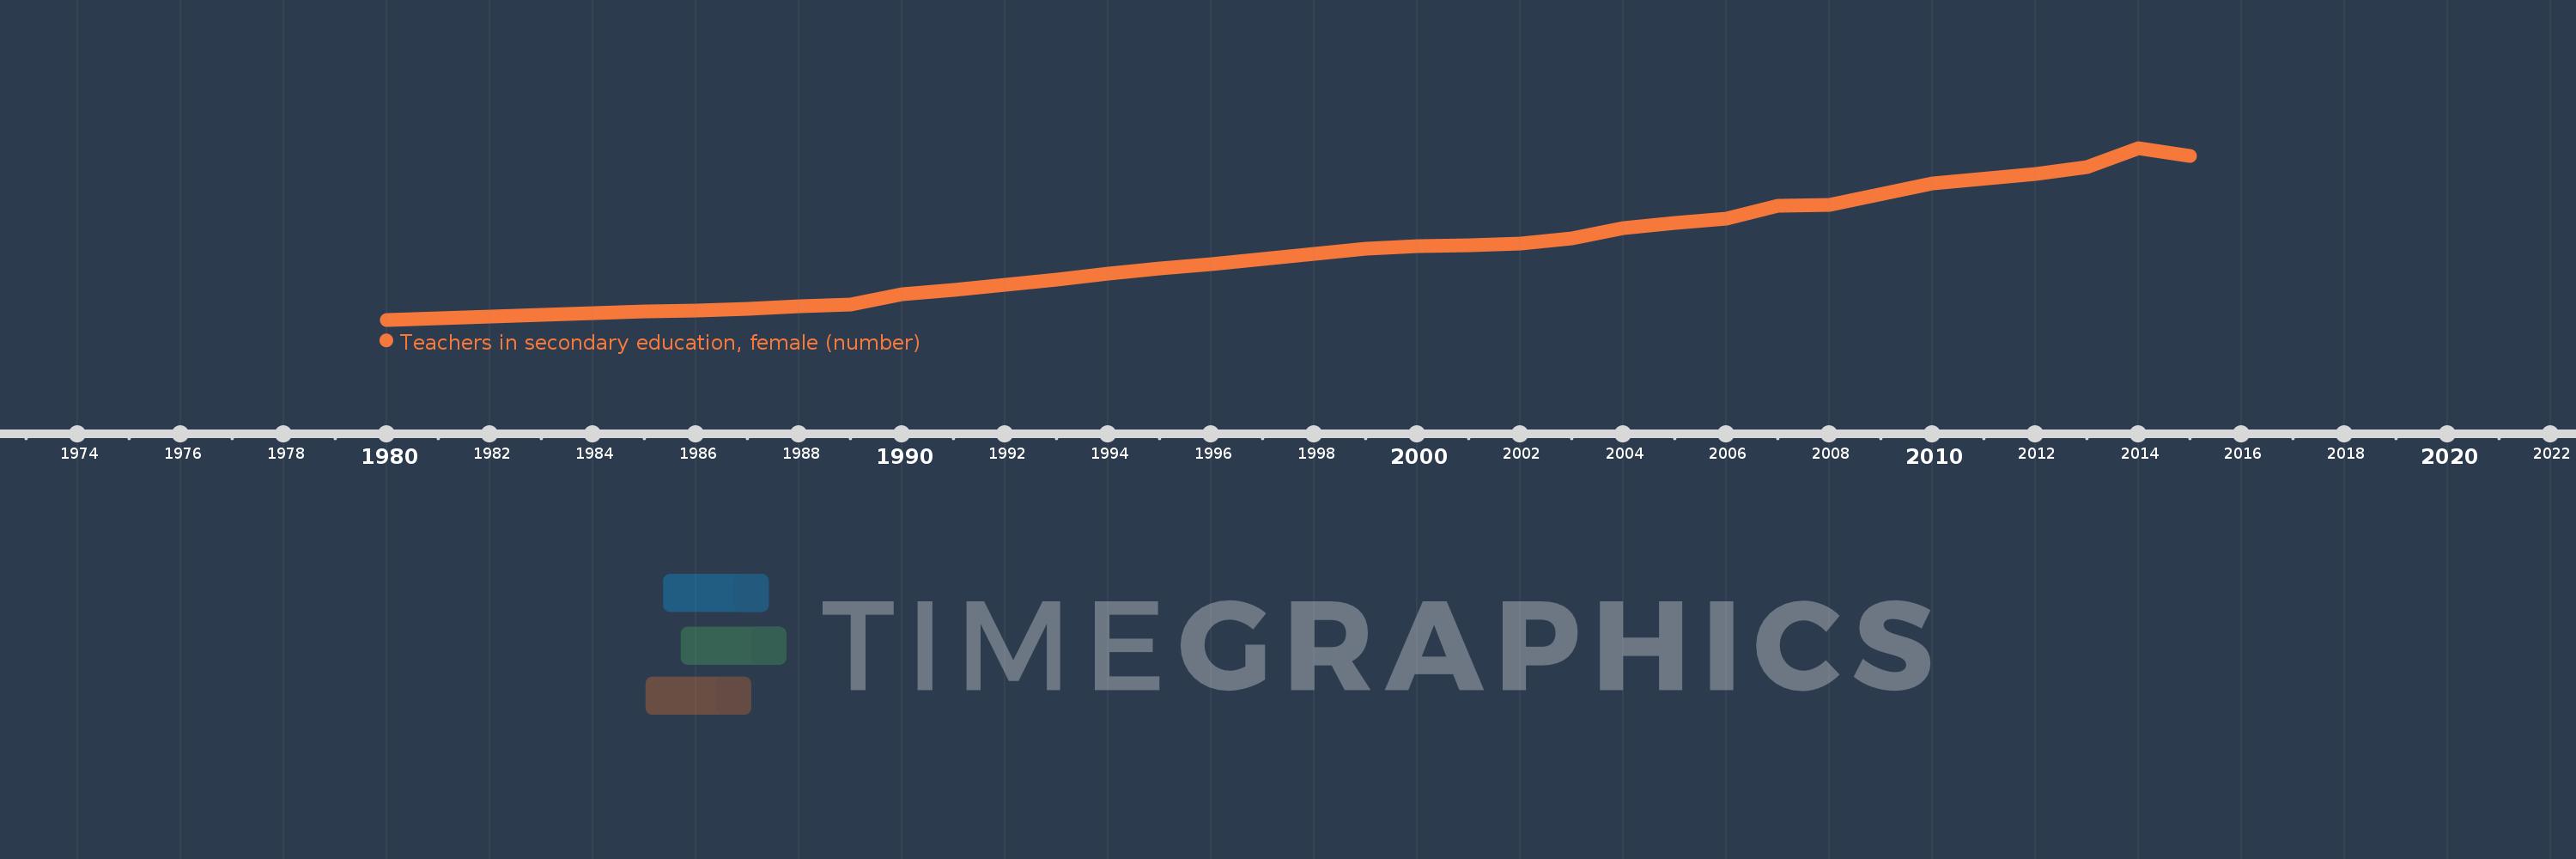
Teachers in secondary education, female (number)
2015,2014,2013,2012,2010,2008,2007,2006,2005,2004,2003,2002,2001,2000,1999,1996,1995,1994,1993,1992,1991,1990,1989,1988,1987,1986,1985,1984,1981,1980
