29
/
en
AIzaSyAYiBZKx7MnpbEhh9jyipgxe19OcubqV5w
April 1, 2024
43920
Latin America & the Caribbean (IDA & IBRD countries)
TLA
false
2
1
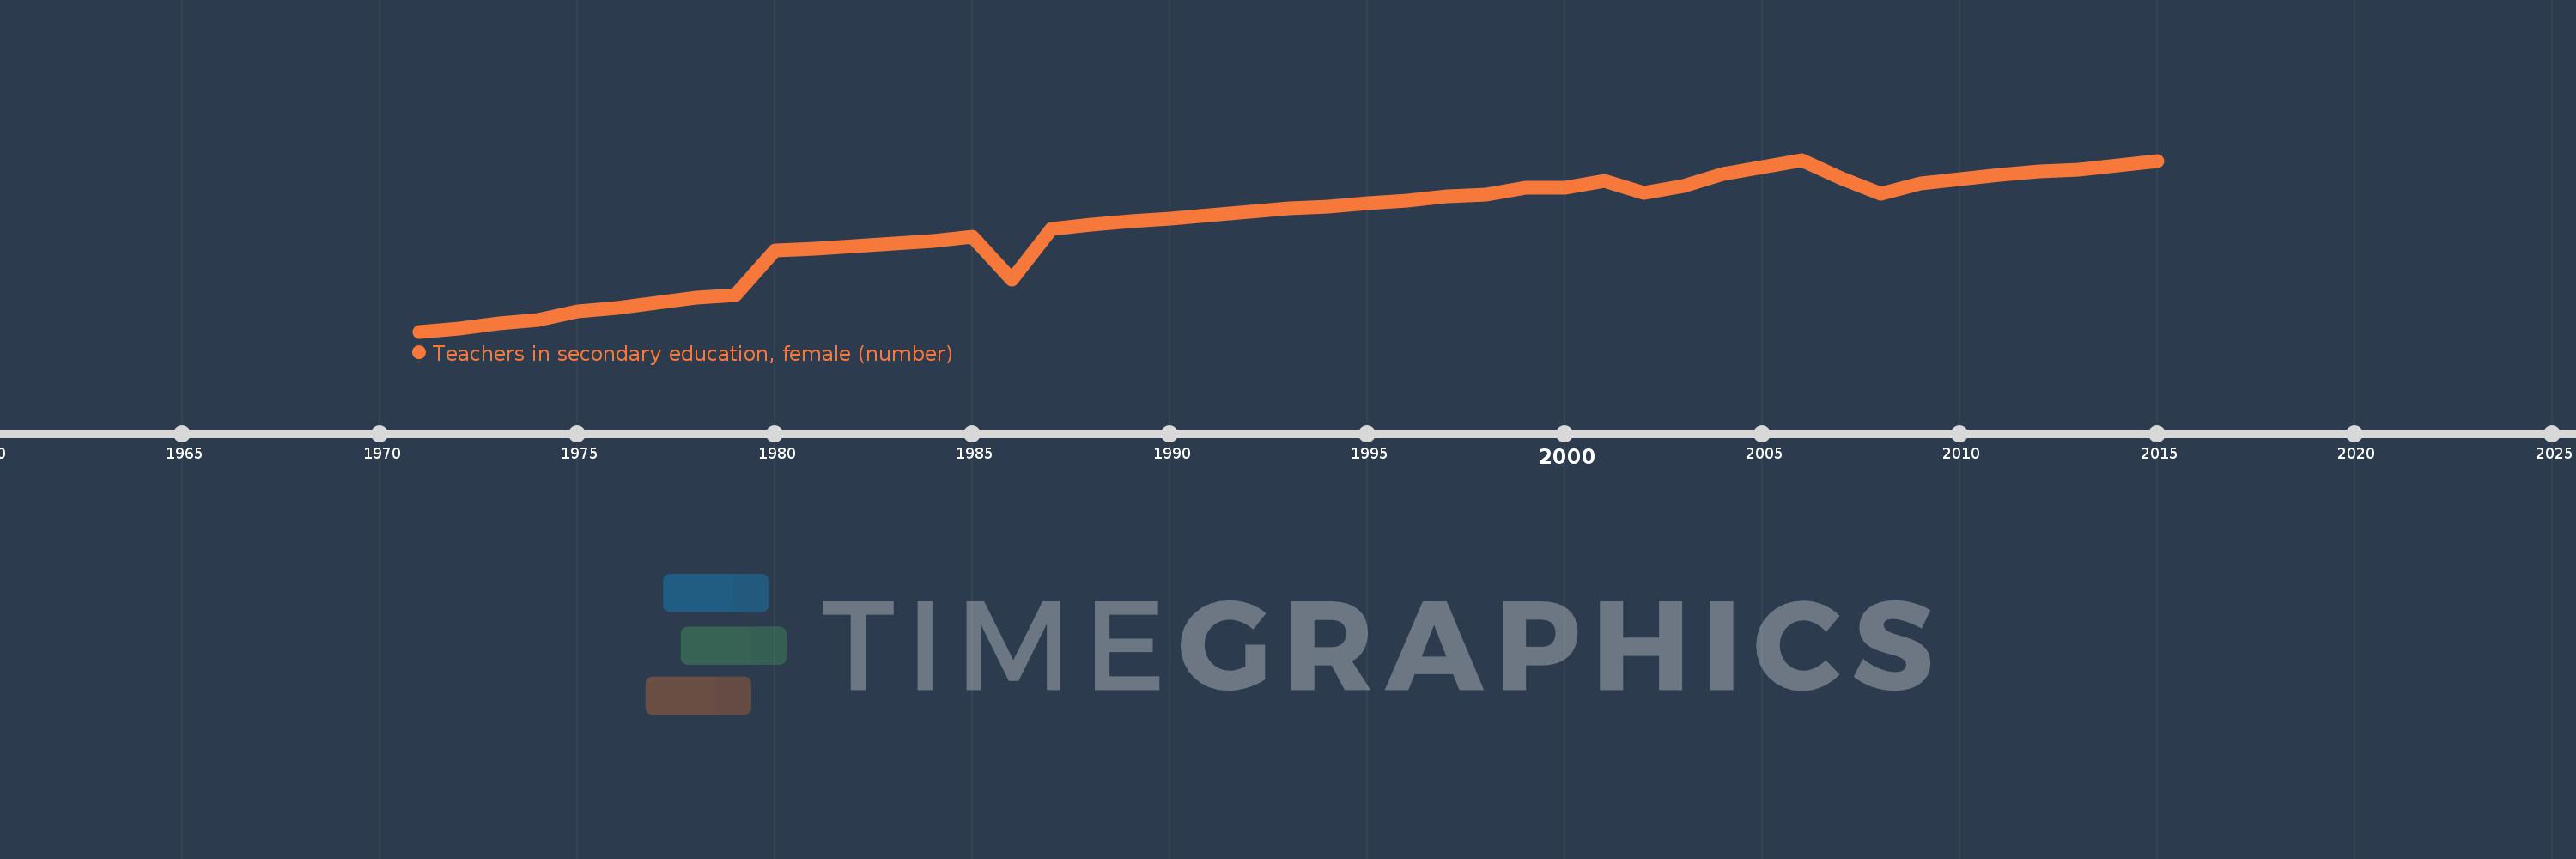
Teachers in secondary education, female (number)
2015,2014,2013,2012,2011,2010,2009,2008,2007,2006,2005,2004,2003,2002,2001,2000,1999,1998,1997,1996,1995,1994,1993,1992,1991,1990,1989,1988,1987,1986,1985,1984,1983,1982,1981,1980,1979,1978,1977,1976,1975,1974,1973,1972,1971
This statistics in other country:
AfghanistanAlbaniaAlgeriaAmerican SamoaAndorraAngolaAntigua and BarbudaArab WorldArgentinaArmeniaArubaAustraliaAustriaBahamas, TheBahrainBangladeshBarbadosBelarusBelgiumBelizeBeninBermudaBhutanBoliviaBosnia and HerzegovinaBotswanaBrazilBritish Virgin IslandsBrunei DarussalamBulgariaBurkina FasoBurundiCabo VerdeCambodiaCameroonCanadaCaribbean small statesCayman IslandsCentral African RepublicCentral Europe and the BalticsChadChileChinaColombiaComorosCongo, Dem. Rep.Congo, Rep.Costa RicaCote d'IvoireCroatiaCubaCyprusCzech RepublicDenmarkDjiboutiDominicaDominican RepublicEarly-demographic dividendEast Asia & PacificEast Asia & Pacific (excluding high income)East Asia & Pacific (IDA & IBRD countries)EcuadorEgypt, Arab Rep.El SalvadorEquatorial GuineaEritreaEstoniaEthiopiaEuro areaEurope & Central AsiaEurope & Central Asia (excluding high income)Europe & Central Asia (IDA & IBRD countries)European UnionFijiFinlandFragile and conflict affected situationsFranceFrench PolynesiaGabonGambia, TheGeorgiaGermanyGhanaGibraltarGreeceGrenadaGuamGuatemalaGuineaGuinea-BissauGuyanaHeavily indebted poor countries (HIPC)High incomeHondurasHong Kong SAR, ChinaHungaryIBRD onlyIcelandIDA & IBRD totalIDA blendIDA onlyIDA totalIndiaIndonesiaIran, Islamic Rep.IraqIrelandIsraelItalyJamaicaJapanJordanKazakhstanKenyaKiribatiKorea, Dem. People’s Rep.Korea, Rep.KuwaitKyrgyz RepublicLao PDRLate-demographic dividendLatin America & Caribbean Latin America & Caribbean (excluding high income)Latin America & the Caribbean (IDA & IBRD countries)LatviaLeast developed countries: UN classificationLebanonLesothoLiberiaLibyaLiechtensteinLithuaniaLow & middle incomeLow incomeLower middle incomeLuxembourgMacao SAR, ChinaMacedonia, FYRMadagascarMalawiMalaysiaMaldivesMaliMaltaMarshall IslandsMauritaniaMauritiusMexicoMiddle East & North AfricaMiddle East & North Africa (excluding high income)Middle East & North Africa (IDA & IBRD countries)Middle incomeMoldovaMonacoMongoliaMoroccoMozambiqueMyanmarNamibiaNauruNepalNetherlandsNew CaledoniaNew ZealandNicaraguaNigerNigeriaNorth AmericaNorwayOECD membersOmanOther small statesPacific island small statesPakistanPalauPanamaPapua New GuineaParaguayPeruPhilippinesPolandPortugalPost-demographic dividendPre-demographic dividendPuerto RicoQatarRomaniaRussian FederationRwandaSamoaSan MarinoSao Tome and PrincipeSaudi ArabiaSenegalSerbiaSeychellesSierra LeoneSingaporeSint Maarten (Dutch part)Slovak RepublicSloveniaSmall statesSolomon IslandsSomaliaSouth AfricaSouth AsiaSouth Asia (IDA & IBRD)SpainSri LankaSt. Kitts and NevisSt. LuciaSt. Vincent and the GrenadinesSub-Saharan Africa Sub-Saharan Africa (excluding high income)Sub-Saharan Africa (IDA & IBRD countries)SudanSurinameSwazilandSwedenSwitzerlandSyrian Arab RepublicTajikistanTanzaniaThailandTimor-LesteTogoTongaTrinidad and TobagoTunisiaTurkeyTurks and Caicos IslandsUgandaUkraineUnited Arab EmiratesUnited KingdomUnited StatesUpper middle incomeUruguayUzbekistanVanuatuVenezuela, RBVietnamVirgin Islands (U.S.)West Bank and GazaWorldYemen, Rep.ZambiaZimbabwe Timeline:
This timeline shows a graph from 1971 to 2015 of Latin America & the Caribbean (IDA & IBRD countries). No data until 1970. Number of actual observations by date: 45.
Source name:
World Development Indicators
Source organization:
UNESCO Institute for Statistics
Categories, topics:
Education
Last updated:
apr 23, 2017
Indicators value changes by year
Minimum:
373.173K
jan 1, 1971
Maximum:
2.22 mln
jan 1, 2006
At the date of observation
Value
Absolute change
Change from previous value
jan 1, 1971
373.173K
+373.173K
0.0%
jan 1, 1972
401.314K
+28.142K
7.54%
jan 1, 1973
458.179K
+56.865K
14.17%
jan 1, 1974
495.985K
+37.806K
8.25%
jan 1, 1975
588.885K
+92.9K
18.73%
jan 1, 1976
626.577K
+37.692K
6.4%
jan 1, 1977
683.073K
+56.496K
9.02%
jan 1, 1978
736.386K
+53.313K
7.8%
jan 1, 1979
762.504K
+26.118K
3.55%
jan 1, 1980
1.243 mln
+480.175K
62.97%
jan 1, 1981
1.265 mln
+22.485K
1.81%
jan 1, 1982
1.29 mln
+24.604K
1.94%
jan 1, 1983
1.319 mln
+29.524K
2.29%
jan 1, 1984
1.351 mln
+31.222K
2.37%
jan 1, 1985
1.39 mln
+39.026K
2.89%
jan 1, 1986
927.927K
-461.612K
-33.22%
jan 1, 1987
1.474 mln
+545.947K
58.84%
jan 1, 1988
1.522 mln
+47.788K
3.24%
jan 1, 1989
1.562 mln
+40.139K
2.64%
jan 1, 1990
1.592 mln
+29.761K
1.91%
jan 1, 1991
1.623 mln
+31.71K
1.99%
jan 1, 1992
1.661 mln
+37.743K
2.33%
jan 1, 1993
1.694 mln
+33.397K
2.01%
jan 1, 1994
1.715 mln
+20.456K
1.21%
jan 1, 1995
1.749 mln
+34.36K
2.0%
jan 1, 1996
1.784 mln
+35.13K
2.01%
jan 1, 1997
1.83 mln
+45.557K
2.55%
jan 1, 1998
1.85 mln
+19.811K
1.08%
jan 1, 1999
1.92 mln
+70.142K
3.79%
jan 1, 2000
1.92 mln
-180.0
-0.01%
jan 1, 2001
1.998 mln
+78.434K
4.09%
jan 1, 2002
1.866 mln
-131.724K
-6.59%
jan 1, 2003
1.94 mln
+73.791K
3.95%
jan 1, 2004
2.071 mln
+131.255K
6.77%
jan 1, 2005
2.14 mln
+68.504K
3.31%
jan 1, 2006
2.22 mln
+80.07K
3.74%
jan 1, 2007
2.025 mln
-195.161K
-8.79%
jan 1, 2008
1.858 mln
-166.648K
-8.23%
jan 1, 2009
1.966 mln
+107.765K
5.8%
jan 1, 2010
2.01 mln
+44.398K
2.26%
jan 1, 2011
2.061 mln
+50.97K
2.54%
jan 1, 2012
2.092 mln
+30.639K
1.49%
jan 1, 2013
2.115 mln
+23.289K
1.11%
jan 1, 2014
2.159 mln
+44.01K
2.08%
jan 1, 2015
2.203 mln
+44.084K
2.04%
Ranking of countries by current statistics by years


Comments: