29
/
en
AIzaSyAYiBZKx7MnpbEhh9jyipgxe19OcubqV5w
April 1, 2024
96851
Burundi
BDI
true
2
1
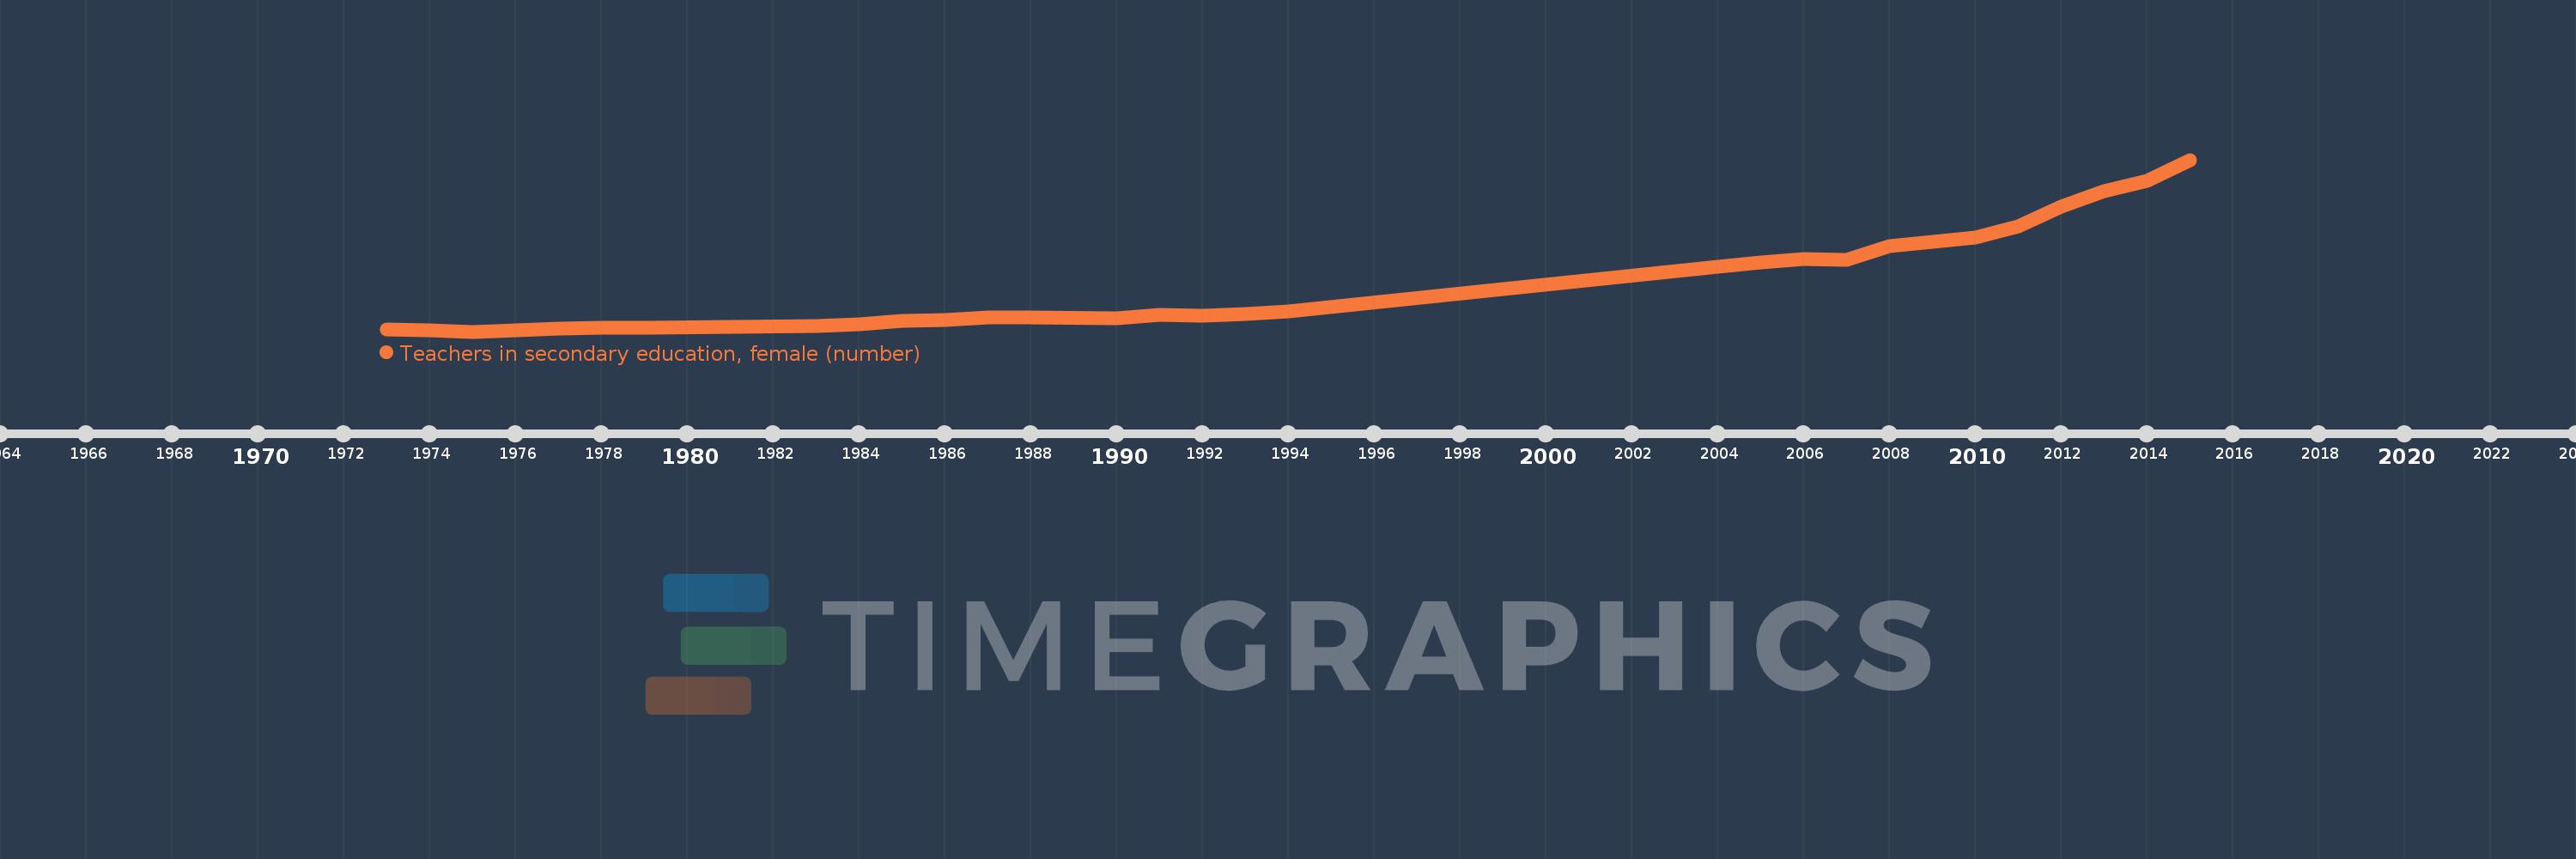
Teachers in secondary education, female (number)
2015,2014,2013,2012,2011,2010,2008,2007,2006,2005,2004,1994,1993,1992,1991,1990,1988,1987,1986,1985,1984,1983,1979,1978,1977,1975,1974,1973
This statistics in other country:
AfghanistanAlbaniaAlgeriaAmerican SamoaAndorraAngolaAntigua and BarbudaArab WorldArgentinaArmeniaArubaAustraliaAustriaBahamas, TheBahrainBangladeshBarbadosBelarusBelgiumBelizeBeninBermudaBhutanBoliviaBosnia and HerzegovinaBotswanaBrazilBritish Virgin IslandsBrunei DarussalamBulgariaBurkina FasoBurundiCabo VerdeCambodiaCameroonCanadaCaribbean small statesCayman IslandsCentral African RepublicCentral Europe and the BalticsChadChileChinaColombiaComorosCongo, Dem. Rep.Congo, Rep.Costa RicaCote d'IvoireCroatiaCubaCyprusCzech RepublicDenmarkDjiboutiDominicaDominican RepublicEarly-demographic dividendEast Asia & PacificEast Asia & Pacific (excluding high income)East Asia & Pacific (IDA & IBRD countries)EcuadorEgypt, Arab Rep.El SalvadorEquatorial GuineaEritreaEstoniaEthiopiaEuro areaEurope & Central AsiaEurope & Central Asia (excluding high income)Europe & Central Asia (IDA & IBRD countries)European UnionFijiFinlandFragile and conflict affected situationsFranceFrench PolynesiaGabonGambia, TheGeorgiaGermanyGhanaGibraltarGreeceGrenadaGuamGuatemalaGuineaGuinea-BissauGuyanaHeavily indebted poor countries (HIPC)High incomeHondurasHong Kong SAR, ChinaHungaryIBRD onlyIcelandIDA & IBRD totalIDA blendIDA onlyIDA totalIndiaIndonesiaIran, Islamic Rep.IraqIrelandIsraelItalyJamaicaJapanJordanKazakhstanKenyaKiribatiKorea, Dem. People’s Rep.Korea, Rep.KuwaitKyrgyz RepublicLao PDRLate-demographic dividendLatin America & Caribbean Latin America & Caribbean (excluding high income)Latin America & the Caribbean (IDA & IBRD countries)LatviaLeast developed countries: UN classificationLebanonLesothoLiberiaLibyaLiechtensteinLithuaniaLow & middle incomeLow incomeLower middle incomeLuxembourgMacao SAR, ChinaMacedonia, FYRMadagascarMalawiMalaysiaMaldivesMaliMaltaMarshall IslandsMauritaniaMauritiusMexicoMiddle East & North AfricaMiddle East & North Africa (excluding high income)Middle East & North Africa (IDA & IBRD countries)Middle incomeMoldovaMonacoMongoliaMoroccoMozambiqueMyanmarNamibiaNauruNepalNetherlandsNew CaledoniaNew ZealandNicaraguaNigerNigeriaNorth AmericaNorwayOECD membersOmanOther small statesPacific island small statesPakistanPalauPanamaPapua New GuineaParaguayPeruPhilippinesPolandPortugalPost-demographic dividendPre-demographic dividendPuerto RicoQatarRomaniaRussian FederationRwandaSamoaSan MarinoSao Tome and PrincipeSaudi ArabiaSenegalSerbiaSeychellesSierra LeoneSingaporeSint Maarten (Dutch part)Slovak RepublicSloveniaSmall statesSolomon IslandsSomaliaSouth AfricaSouth AsiaSouth Asia (IDA & IBRD)SpainSri LankaSt. Kitts and NevisSt. LuciaSt. Vincent and the GrenadinesSub-Saharan Africa Sub-Saharan Africa (excluding high income)Sub-Saharan Africa (IDA & IBRD countries)SudanSurinameSwazilandSwedenSwitzerlandSyrian Arab RepublicTajikistanTanzaniaThailandTimor-LesteTogoTongaTrinidad and TobagoTunisiaTurkeyTurks and Caicos IslandsUgandaUkraineUnited Arab EmiratesUnited KingdomUnited StatesUpper middle incomeUruguayUzbekistanVanuatuVenezuela, RBVietnamVirgin Islands (U.S.)West Bank and GazaWorldYemen, Rep.ZambiaZimbabwe Timeline:
This timeline shows a graph from 1973 to 2015 of Burundi. No data until 1972. Number of actual observations by date: 28.
Source name:
World Development Indicators
Source organization:
UNESCO Institute for Statistics
Categories, topics:
Education
Last updated:
apr 23, 2017
Indicators value changes by year
At the date of observation
Value
Absolute change
Change from previous value
jan 1, 1973
152.0
+152.0
0.0%
jan 1, 1974
129.0
-23.0
-15.13%
jan 1, 1975
103.0
-26.0
-20.16%
jan 1, 1977
156.0
+53.0
51.46%
jan 1, 1978
182.0
+26.0
16.67%
jan 1, 1979
190.0
+8.0
4.4%
jan 1, 1983
211.0
+21.0
11.05%
jan 1, 1984
259.0
+48.0
22.75%
jan 1, 1985
327.0
+68.0
26.25%
jan 1, 1986
343.0
+16.0
4.89%
jan 1, 1987
382.0
+39.0
11.37%
jan 1, 1988
385.0
+3.0
0.79%
jan 1, 1990
380.0
-5.0
-1.3%
jan 1, 1991
441.0
+61.0
16.05%
jan 1, 1992
429.0
-12.0
-2.72%
jan 1, 1993
459.0
+30.0
6.99%
jan 1, 1994
519.0
+60.0
13.07%
jan 1, 2004
1.425K
+906.0
174.57%
jan 1, 2005
1.503K
+78.0
5.47%
jan 1, 2006
1.581K
+78.0
5.19%
jan 1, 2007
1.559K
-22.0
-1.39%
jan 1, 2008
1.831K
+272.0
17.45%
jan 1, 2010
2.019K
+188.0
10.27%
jan 1, 2011
2.231K
+212.0
10.5%
jan 1, 2012
2.64K
+409.0
18.33%
jan 1, 2013
2.945K
+305.0
11.55%
jan 1, 2014
3.161K
+216.0
7.33%
jan 1, 2015
3.59K
+429.0
13.57%
Ranking of countries by current statistics by years


Comments: