30
/
AIzaSyAYiBZKx7MnpbEhh9jyipgxe19OcubqV5w
April 1, 2024
172267
Kuwait
KWT
true
2
1
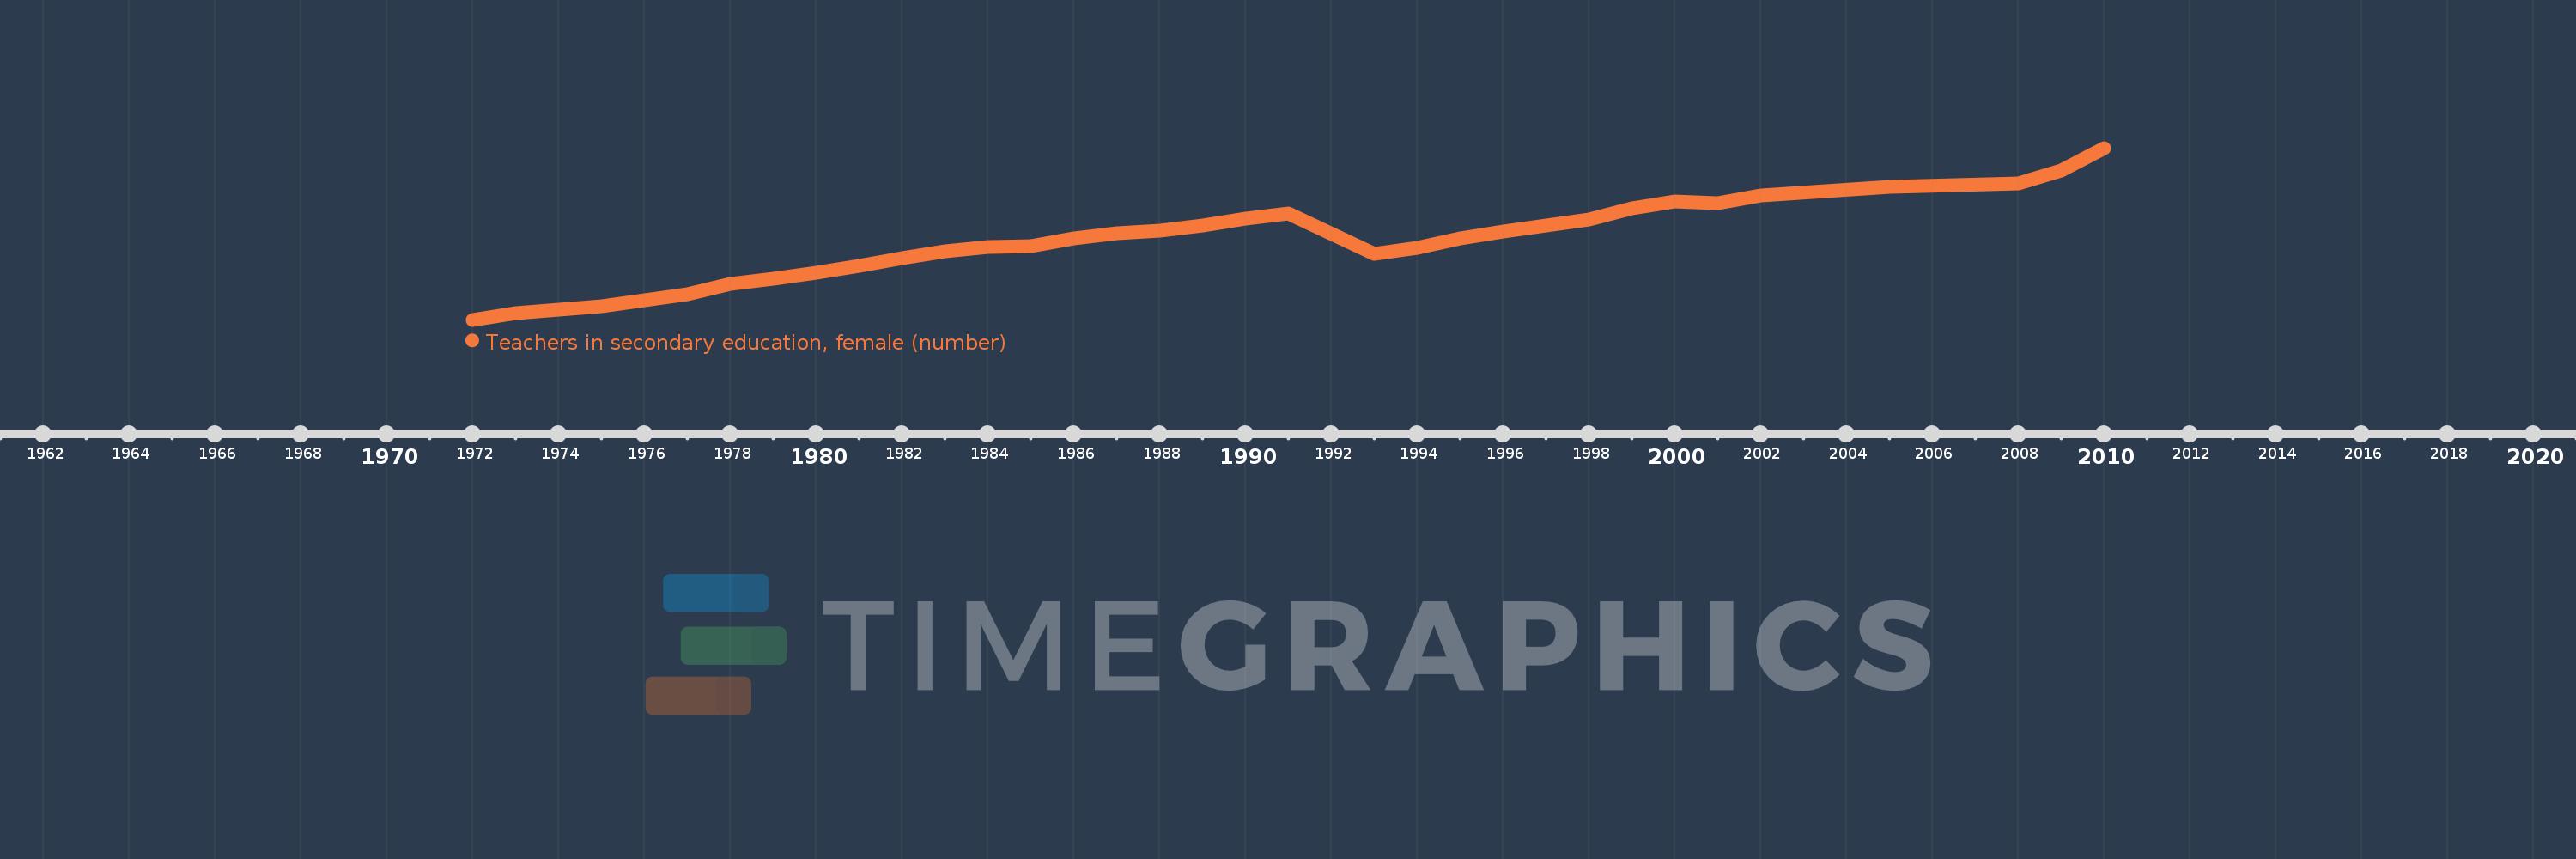
Teachers in secondary education, female (number)
2010,2009,2008,2005,2002,2001,2000,1999,1998,1996,1995,1994,1993,1991,1990,1989,1988,1987,1986,1985,1984,1983,1982,1981,1980,1979,1978,1977,1976,1975,1974,1973,1972
