29
/
en
AIzaSyAYiBZKx7MnpbEhh9jyipgxe19OcubqV5w
April 1, 2024
134658
France
FRA
true
2
1
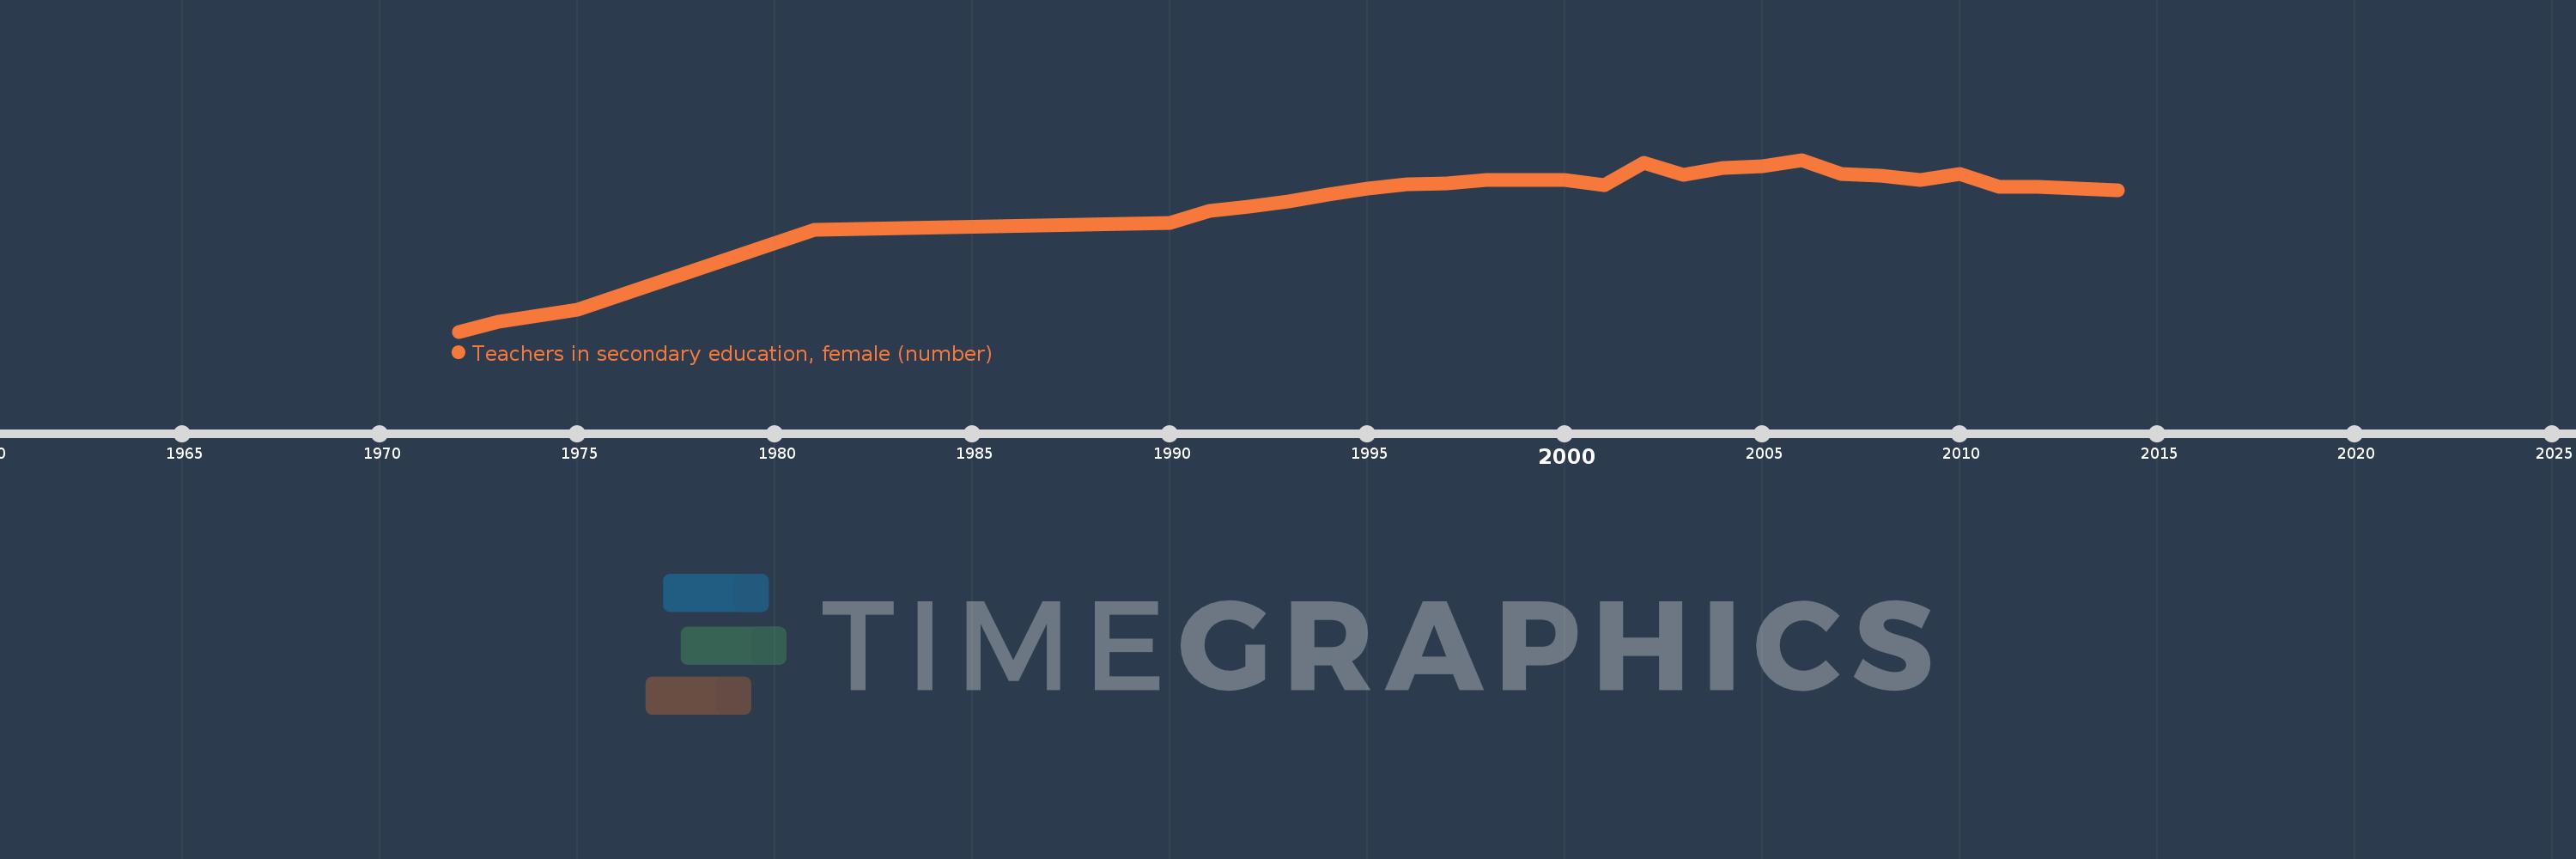
Teachers in secondary education, female (number)
2014,2013,2012,2011,2010,2009,2008,2007,2006,2005,2004,2003,2002,2001,2000,1998,1997,1996,1995,1994,1993,1992,1991,1990,1981,1975,1973,1972
This statistics in other country:
AfghanistanAlbaniaAlgeriaAmerican SamoaAndorraAngolaAntigua and BarbudaArab WorldArgentinaArmeniaArubaAustraliaAustriaBahamas, TheBahrainBangladeshBarbadosBelarusBelgiumBelizeBeninBermudaBhutanBoliviaBosnia and HerzegovinaBotswanaBrazilBritish Virgin IslandsBrunei DarussalamBulgariaBurkina FasoBurundiCabo VerdeCambodiaCameroonCanadaCaribbean small statesCayman IslandsCentral African RepublicCentral Europe and the BalticsChadChileChinaColombiaComorosCongo, Dem. Rep.Congo, Rep.Costa RicaCote d'IvoireCroatiaCubaCyprusCzech RepublicDenmarkDjiboutiDominicaDominican RepublicEarly-demographic dividendEast Asia & PacificEast Asia & Pacific (excluding high income)East Asia & Pacific (IDA & IBRD countries)EcuadorEgypt, Arab Rep.El SalvadorEquatorial GuineaEritreaEstoniaEthiopiaEuro areaEurope & Central AsiaEurope & Central Asia (excluding high income)Europe & Central Asia (IDA & IBRD countries)European UnionFijiFinlandFragile and conflict affected situationsFranceFrench PolynesiaGabonGambia, TheGeorgiaGermanyGhanaGibraltarGreeceGrenadaGuamGuatemalaGuineaGuinea-BissauGuyanaHeavily indebted poor countries (HIPC)High incomeHondurasHong Kong SAR, ChinaHungaryIBRD onlyIcelandIDA & IBRD totalIDA blendIDA onlyIDA totalIndiaIndonesiaIran, Islamic Rep.IraqIrelandIsraelItalyJamaicaJapanJordanKazakhstanKenyaKiribatiKorea, Dem. People’s Rep.Korea, Rep.KuwaitKyrgyz RepublicLao PDRLate-demographic dividendLatin America & Caribbean Latin America & Caribbean (excluding high income)Latin America & the Caribbean (IDA & IBRD countries)LatviaLeast developed countries: UN classificationLebanonLesothoLiberiaLibyaLiechtensteinLithuaniaLow & middle incomeLow incomeLower middle incomeLuxembourgMacao SAR, ChinaMacedonia, FYRMadagascarMalawiMalaysiaMaldivesMaliMaltaMarshall IslandsMauritaniaMauritiusMexicoMiddle East & North AfricaMiddle East & North Africa (excluding high income)Middle East & North Africa (IDA & IBRD countries)Middle incomeMoldovaMonacoMongoliaMoroccoMozambiqueMyanmarNamibiaNauruNepalNetherlandsNew CaledoniaNew ZealandNicaraguaNigerNigeriaNorth AmericaNorwayOECD membersOmanOther small statesPacific island small statesPakistanPalauPanamaPapua New GuineaParaguayPeruPhilippinesPolandPortugalPost-demographic dividendPre-demographic dividendPuerto RicoQatarRomaniaRussian FederationRwandaSamoaSan MarinoSao Tome and PrincipeSaudi ArabiaSenegalSerbiaSeychellesSierra LeoneSingaporeSint Maarten (Dutch part)Slovak RepublicSloveniaSmall statesSolomon IslandsSomaliaSouth AfricaSouth AsiaSouth Asia (IDA & IBRD)SpainSri LankaSt. Kitts and NevisSt. LuciaSt. Vincent and the GrenadinesSub-Saharan Africa Sub-Saharan Africa (excluding high income)Sub-Saharan Africa (IDA & IBRD countries)SudanSurinameSwazilandSwedenSwitzerlandSyrian Arab RepublicTajikistanTanzaniaThailandTimor-LesteTogoTongaTrinidad and TobagoTunisiaTurkeyTurks and Caicos IslandsUgandaUkraineUnited Arab EmiratesUnited KingdomUnited StatesUpper middle incomeUruguayUzbekistanVanuatuVenezuela, RBVietnamVirgin Islands (U.S.)West Bank and GazaWorldYemen, Rep.ZambiaZimbabwe Timeline:
This timeline shows a graph from 1972 to 2014 of France. No data until 1971. Number of actual observations by date: 28.
Source name:
World Development Indicators
Source organization:
UNESCO Institute for Statistics
Categories, topics:
Education
Last updated:
apr 23, 2017
Indicators value changes by year
Minimum:
109.683K
jan 1, 1972
Maximum:
306.582K
jan 1, 2006
At the date of observation
Value
Absolute change
Change from previous value
jan 1, 1972
109.683K
+109.683K
0.0%
jan 1, 1973
120.909K
+11.226K
10.23%
jan 1, 1975
135.248K
+14.339K
11.86%
jan 1, 1981
226.58K
+91.332K
67.53%
jan 1, 1990
234.639K
+8.059K
3.56%
jan 1, 1991
248.346K
+13.707K
5.84%
jan 1, 1992
253.119K
+4.773K
1.92%
jan 1, 1993
258.602K
+5.483K
2.17%
jan 1, 1994
267.036K
+8.434K
3.26%
jan 1, 1995
273.316K
+6.28K
2.35%
jan 1, 1996
278.667K
+5.351K
1.96%
jan 1, 1997
279.944K
+1.277K
0.46%
jan 1, 1998
283.186K
+3.242K
1.16%
jan 1, 2000
283.585K
+399.0
0.14%
jan 1, 2001
277.41K
-6.175K
-2.18%
jan 1, 2002
303.32K
+25.91K
9.34%
jan 1, 2003
289.427K
-13.893K
-4.58%
jan 1, 2004
297.095K
+7.668K
2.65%
jan 1, 2005
299.434K
+2.339K
0.79%
jan 1, 2006
306.582K
+7.148K
2.39%
jan 1, 2007
290.752K
-15.83K
-5.16%
jan 1, 2008
288.747K
-2.005K
-0.69%
jan 1, 2009
283.07K
-5.677K
-1.97%
jan 1, 2010
289.951K
+6.881K
2.43%
jan 1, 2011
275.342K
-14.609K
-5.04%
jan 1, 2012
275.822K
+480.0
0.17%
jan 1, 2013
273.454K
-2.368K
-0.86%
jan 1, 2014
271.734K
-1.72K
-0.63%
Ranking of countries by current statistics by years


Comments: