29
/
en
AIzaSyAYiBZKx7MnpbEhh9jyipgxe19OcubqV5w
April 1, 2024
212426
Niger
NER
true
2
1
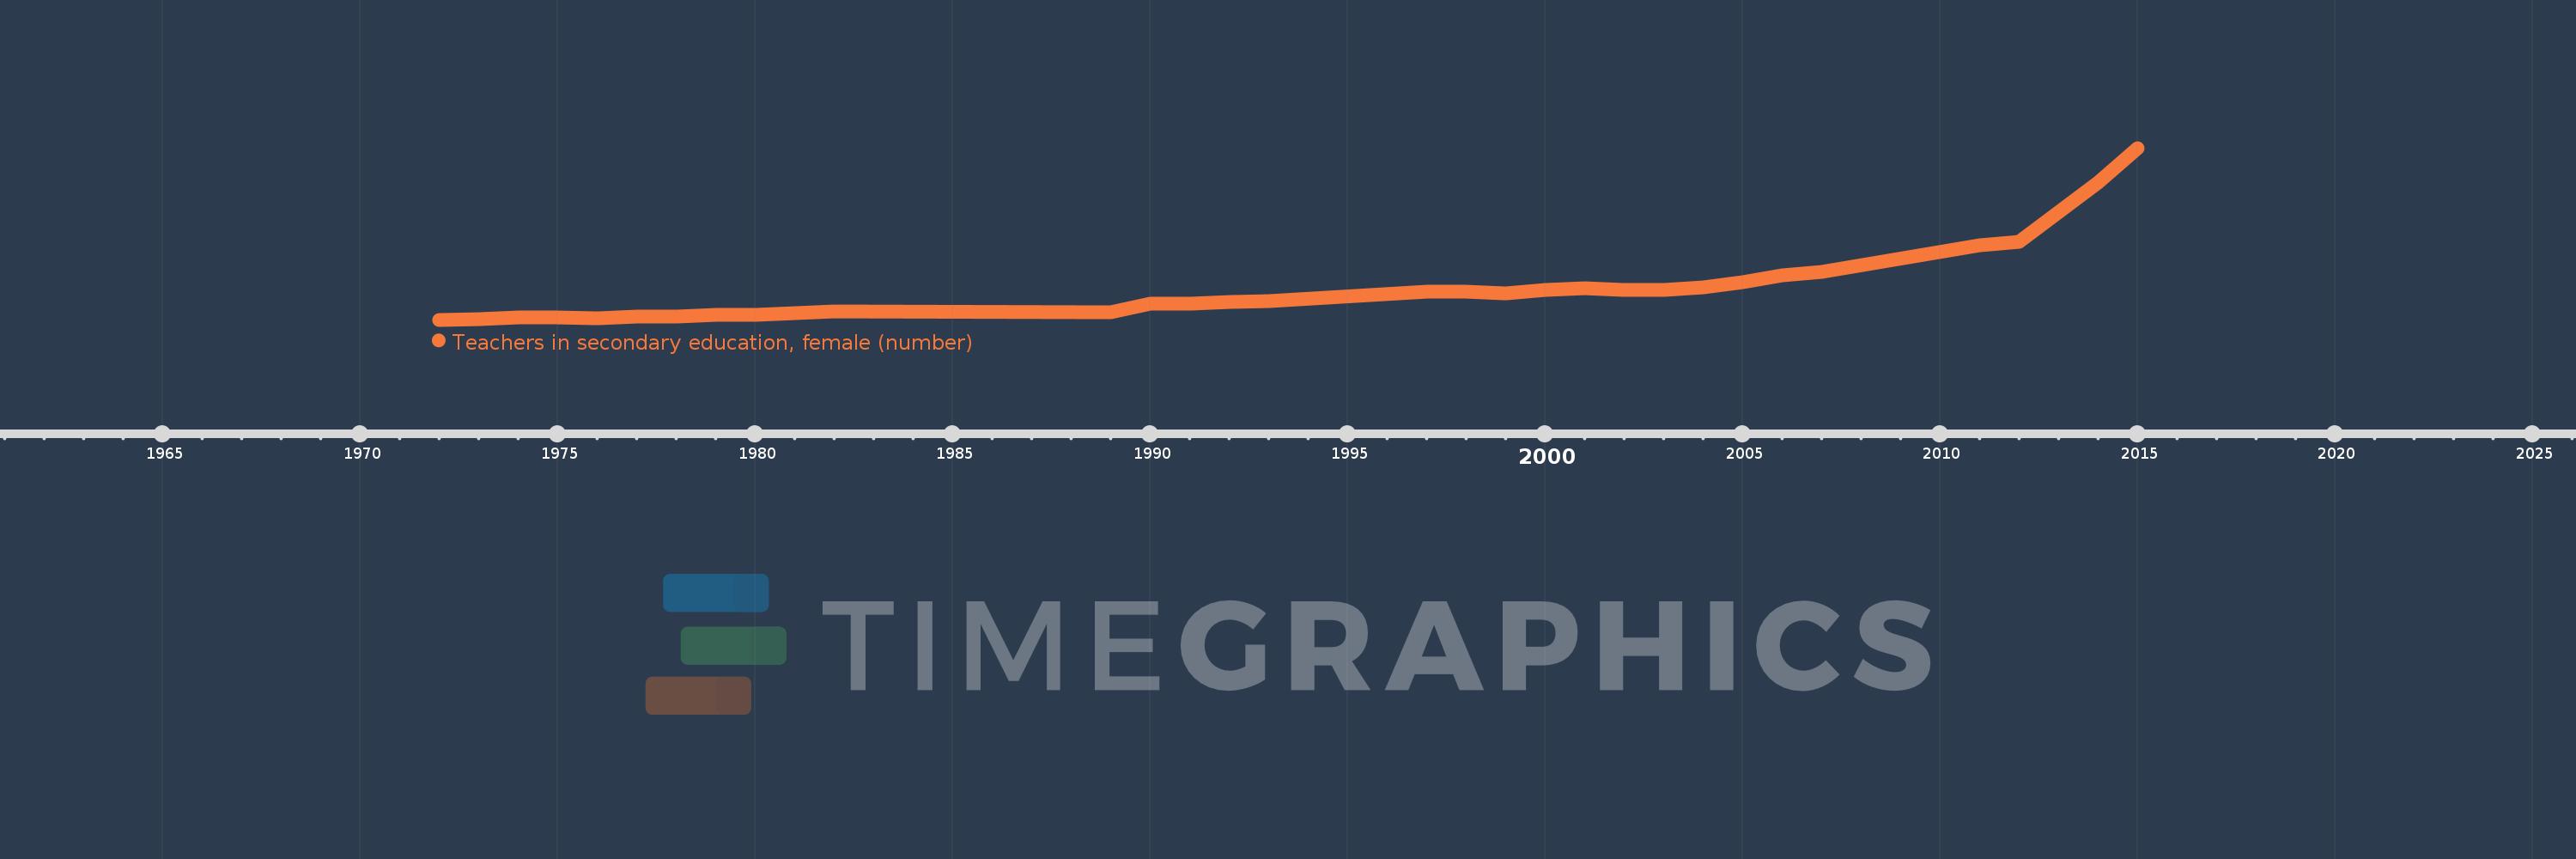
Teachers in secondary education, female (number)
2015,2014,2012,2011,2007,2006,2005,2004,2003,2002,2001,2000,1999,1998,1997,1993,1992,1991,1990,1989,1982,1981,1980,1979,1978,1977,1976,1975,1974,1973,1972
This statistics in other country:
AfghanistanAlbaniaAlgeriaAmerican SamoaAndorraAngolaAntigua and BarbudaArab WorldArgentinaArmeniaArubaAustraliaAustriaBahamas, TheBahrainBangladeshBarbadosBelarusBelgiumBelizeBeninBermudaBhutanBoliviaBosnia and HerzegovinaBotswanaBrazilBritish Virgin IslandsBrunei DarussalamBulgariaBurkina FasoBurundiCabo VerdeCambodiaCameroonCanadaCaribbean small statesCayman IslandsCentral African RepublicCentral Europe and the BalticsChadChileChinaColombiaComorosCongo, Dem. Rep.Congo, Rep.Costa RicaCote d'IvoireCroatiaCubaCyprusCzech RepublicDenmarkDjiboutiDominicaDominican RepublicEarly-demographic dividendEast Asia & PacificEast Asia & Pacific (excluding high income)East Asia & Pacific (IDA & IBRD countries)EcuadorEgypt, Arab Rep.El SalvadorEquatorial GuineaEritreaEstoniaEthiopiaEuro areaEurope & Central AsiaEurope & Central Asia (excluding high income)Europe & Central Asia (IDA & IBRD countries)European UnionFijiFinlandFragile and conflict affected situationsFranceFrench PolynesiaGabonGambia, TheGeorgiaGermanyGhanaGibraltarGreeceGrenadaGuamGuatemalaGuineaGuinea-BissauGuyanaHeavily indebted poor countries (HIPC)High incomeHondurasHong Kong SAR, ChinaHungaryIBRD onlyIcelandIDA & IBRD totalIDA blendIDA onlyIDA totalIndiaIndonesiaIran, Islamic Rep.IraqIrelandIsraelItalyJamaicaJapanJordanKazakhstanKenyaKiribatiKorea, Dem. People’s Rep.Korea, Rep.KuwaitKyrgyz RepublicLao PDRLate-demographic dividendLatin America & Caribbean Latin America & Caribbean (excluding high income)Latin America & the Caribbean (IDA & IBRD countries)LatviaLeast developed countries: UN classificationLebanonLesothoLiberiaLibyaLiechtensteinLithuaniaLow & middle incomeLow incomeLower middle incomeLuxembourgMacao SAR, ChinaMacedonia, FYRMadagascarMalawiMalaysiaMaldivesMaliMaltaMarshall IslandsMauritaniaMauritiusMexicoMiddle East & North AfricaMiddle East & North Africa (excluding high income)Middle East & North Africa (IDA & IBRD countries)Middle incomeMoldovaMonacoMongoliaMoroccoMozambiqueMyanmarNamibiaNauruNepalNetherlandsNew CaledoniaNew ZealandNicaraguaNigerNigeriaNorth AmericaNorwayOECD membersOmanOther small statesPacific island small statesPakistanPalauPanamaPapua New GuineaParaguayPeruPhilippinesPolandPortugalPost-demographic dividendPre-demographic dividendPuerto RicoQatarRomaniaRussian FederationRwandaSamoaSan MarinoSao Tome and PrincipeSaudi ArabiaSenegalSerbiaSeychellesSierra LeoneSingaporeSint Maarten (Dutch part)Slovak RepublicSloveniaSmall statesSolomon IslandsSomaliaSouth AfricaSouth AsiaSouth Asia (IDA & IBRD)SpainSri LankaSt. Kitts and NevisSt. LuciaSt. Vincent and the GrenadinesSub-Saharan Africa Sub-Saharan Africa (excluding high income)Sub-Saharan Africa (IDA & IBRD countries)SudanSurinameSwazilandSwedenSwitzerlandSyrian Arab RepublicTajikistanTanzaniaThailandTimor-LesteTogoTongaTrinidad and TobagoTunisiaTurkeyTurks and Caicos IslandsUgandaUkraineUnited Arab EmiratesUnited KingdomUnited StatesUpper middle incomeUruguayUzbekistanVanuatuVenezuela, RBVietnamVirgin Islands (U.S.)West Bank and GazaWorldYemen, Rep.ZambiaZimbabwe Timeline:
This timeline shows a graph from 1972 to 2015 of Niger. No data until 1971. Number of actual observations by date: 31.
Source name:
World Development Indicators
Source organization:
UNESCO Institute for Statistics
Categories, topics:
Education
Last updated:
apr 23, 2017
Indicators value changes by year
Maximum:
4.106K
jan 1, 2015
At the date of observation
Value
Absolute change
Change from previous value
jan 1, 1972
75.0
+75.0
0.0%
jan 1, 1973
93.0
+18.0
24.0%
jan 1, 1974
136.0
+43.0
46.24%
jan 1, 1975
137.0
+1.0
0.74%
jan 1, 1976
112.0
-25.0
-18.25%
jan 1, 1977
146.0
+34.0
30.36%
jan 1, 1978
158.0
+12.0
8.22%
jan 1, 1979
181.0
+23.0
14.56%
jan 1, 1980
187.0
+6.0
3.31%
jan 1, 1981
233.0
+46.0
24.6%
jan 1, 1982
267.0
+34.0
14.59%
jan 1, 1989
260.0
-7.0
-2.62%
jan 1, 1990
447.0
+187.0
71.92%
jan 1, 1991
457.0
+10.0
2.24%
jan 1, 1992
490.0
+33.0
7.22%
jan 1, 1993
520.0
+30.0
6.12%
jan 1, 1997
736.0
+216.0
41.54%
jan 1, 1998
736.0
0.0
0.0%
jan 1, 1999
698.0
-38.0
-5.16%
jan 1, 2000
776.0
+78.0
11.17%
jan 1, 2001
819.0
+43.0
5.54%
jan 1, 2002
773.0
-46.0
-5.62%
jan 1, 2003
782.0
+9.0
1.16%
jan 1, 2004
842.0
+60.0
7.67%
jan 1, 2005
955.0
+113.0
13.42%
jan 1, 2006
1.107K
+152.0
15.92%
jan 1, 2007
1.204K
+97.0
8.76%
jan 1, 2011
1.82K
+616.0
51.16%
jan 1, 2012
1.91K
+90.0
4.95%
jan 1, 2014
3.302K
+1.392K
72.88%
jan 1, 2015
4.106K
+804.0
24.35%
Ranking of countries by current statistics by years


Comments: