29
/
en
AIzaSyAYiBZKx7MnpbEhh9jyipgxe19OcubqV5w
April 1, 2024
43056
Latin America & Caribbean (excluding high income)
LAC
false
2
1
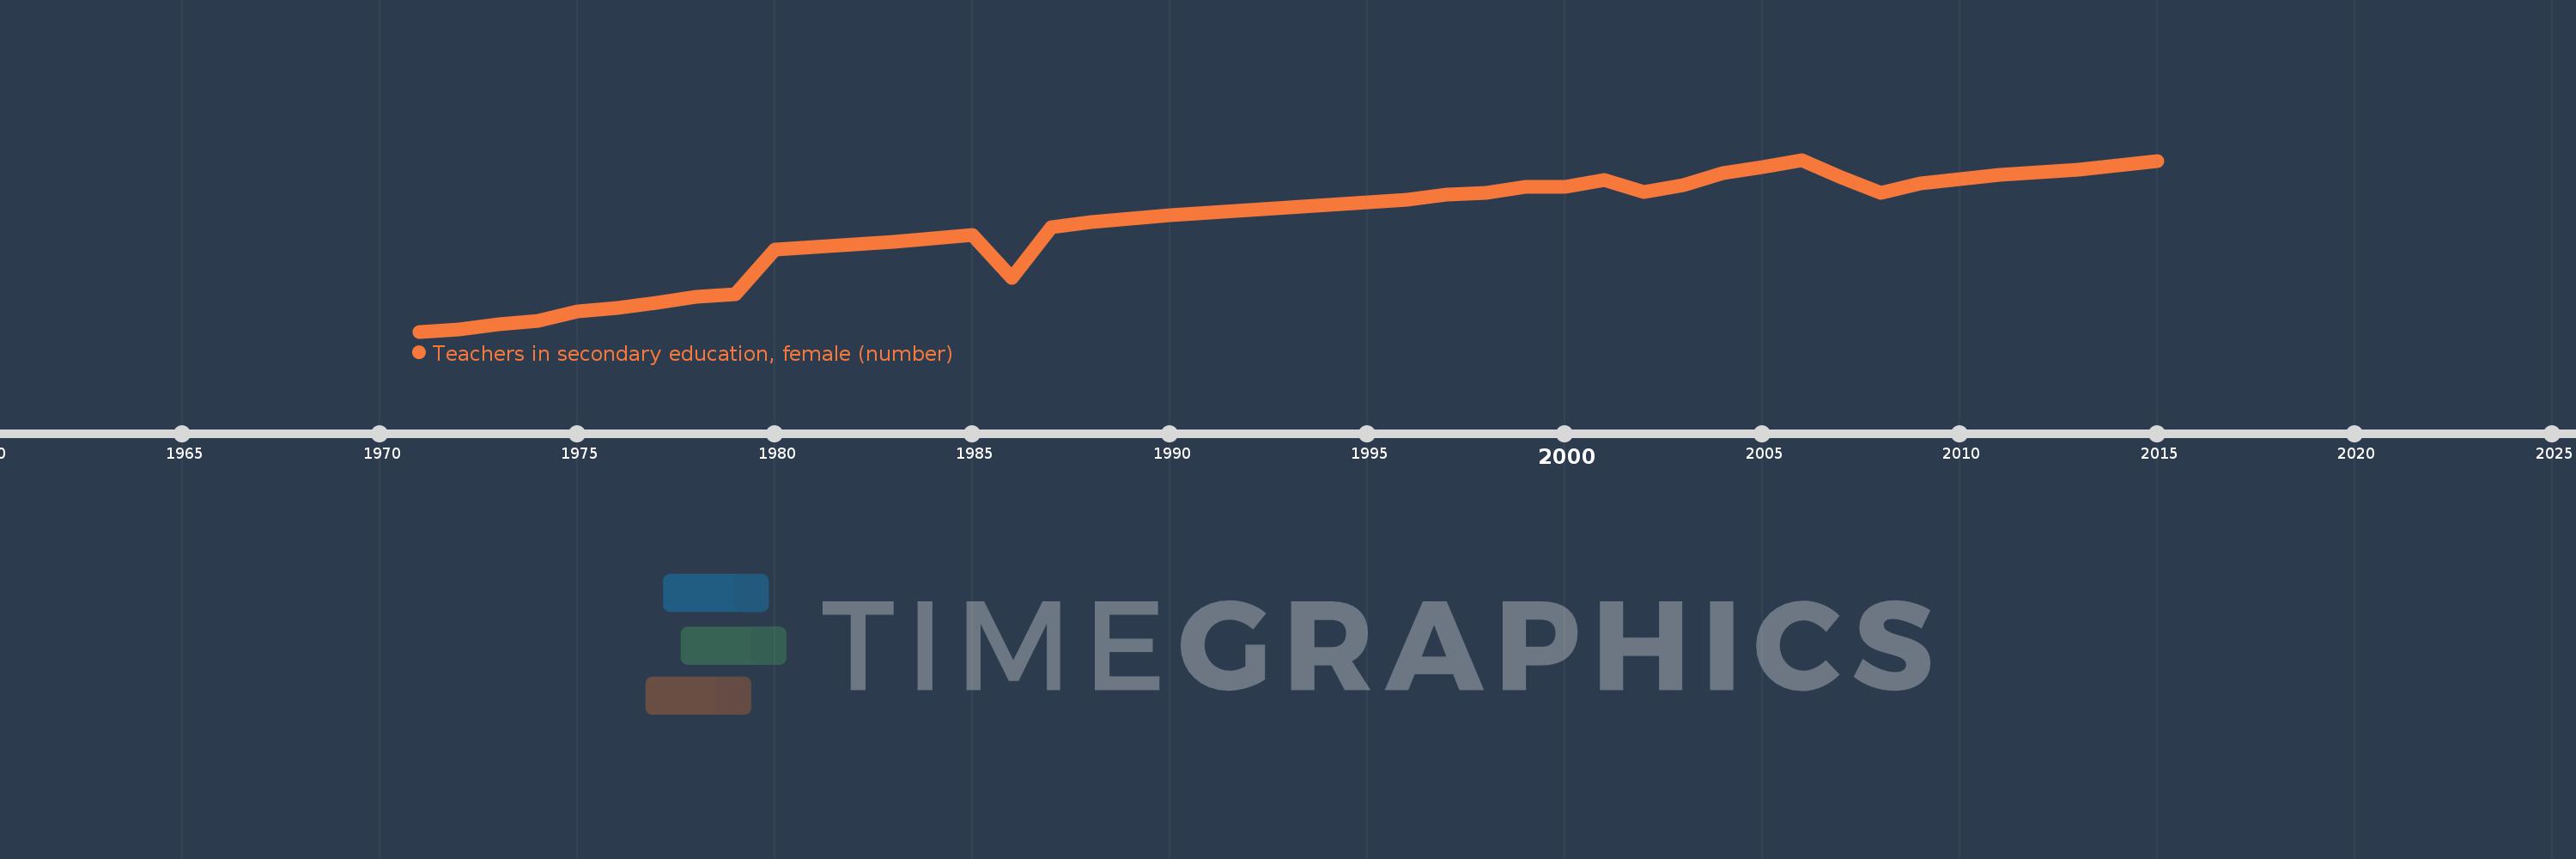
Teachers in secondary education, female (number)
2015,2014,2013,2012,2011,2010,2009,2008,2007,2006,2005,2004,2003,2002,2001,2000,1999,1998,1997,1996,1995,1994,1993,1992,1991,1990,1989,1988,1987,1986,1985,1984,1983,1982,1981,1980,1979,1978,1977,1976,1975,1974,1973,1972,1971
This statistics in other country:
AfghanistanAlbaniaAlgeriaAmerican SamoaAndorraAngolaAntigua and BarbudaArab WorldArgentinaArmeniaArubaAustraliaAustriaBahamas, TheBahrainBangladeshBarbadosBelarusBelgiumBelizeBeninBermudaBhutanBoliviaBosnia and HerzegovinaBotswanaBrazilBritish Virgin IslandsBrunei DarussalamBulgariaBurkina FasoBurundiCabo VerdeCambodiaCameroonCanadaCaribbean small statesCayman IslandsCentral African RepublicCentral Europe and the BalticsChadChileChinaColombiaComorosCongo, Dem. Rep.Congo, Rep.Costa RicaCote d'IvoireCroatiaCubaCyprusCzech RepublicDenmarkDjiboutiDominicaDominican RepublicEarly-demographic dividendEast Asia & PacificEast Asia & Pacific (excluding high income)East Asia & Pacific (IDA & IBRD countries)EcuadorEgypt, Arab Rep.El SalvadorEquatorial GuineaEritreaEstoniaEthiopiaEuro areaEurope & Central AsiaEurope & Central Asia (excluding high income)Europe & Central Asia (IDA & IBRD countries)European UnionFijiFinlandFragile and conflict affected situationsFranceFrench PolynesiaGabonGambia, TheGeorgiaGermanyGhanaGibraltarGreeceGrenadaGuamGuatemalaGuineaGuinea-BissauGuyanaHeavily indebted poor countries (HIPC)High incomeHondurasHong Kong SAR, ChinaHungaryIBRD onlyIcelandIDA & IBRD totalIDA blendIDA onlyIDA totalIndiaIndonesiaIran, Islamic Rep.IraqIrelandIsraelItalyJamaicaJapanJordanKazakhstanKenyaKiribatiKorea, Dem. People’s Rep.Korea, Rep.KuwaitKyrgyz RepublicLao PDRLate-demographic dividendLatin America & Caribbean Latin America & Caribbean (excluding high income)Latin America & the Caribbean (IDA & IBRD countries)LatviaLeast developed countries: UN classificationLebanonLesothoLiberiaLibyaLiechtensteinLithuaniaLow & middle incomeLow incomeLower middle incomeLuxembourgMacao SAR, ChinaMacedonia, FYRMadagascarMalawiMalaysiaMaldivesMaliMaltaMarshall IslandsMauritaniaMauritiusMexicoMiddle East & North AfricaMiddle East & North Africa (excluding high income)Middle East & North Africa (IDA & IBRD countries)Middle incomeMoldovaMonacoMongoliaMoroccoMozambiqueMyanmarNamibiaNauruNepalNetherlandsNew CaledoniaNew ZealandNicaraguaNigerNigeriaNorth AmericaNorwayOECD membersOmanOther small statesPacific island small statesPakistanPalauPanamaPapua New GuineaParaguayPeruPhilippinesPolandPortugalPost-demographic dividendPre-demographic dividendPuerto RicoQatarRomaniaRussian FederationRwandaSamoaSan MarinoSao Tome and PrincipeSaudi ArabiaSenegalSerbiaSeychellesSierra LeoneSingaporeSint Maarten (Dutch part)Slovak RepublicSloveniaSmall statesSolomon IslandsSomaliaSouth AfricaSouth AsiaSouth Asia (IDA & IBRD)SpainSri LankaSt. Kitts and NevisSt. LuciaSt. Vincent and the GrenadinesSub-Saharan Africa Sub-Saharan Africa (excluding high income)Sub-Saharan Africa (IDA & IBRD countries)SudanSurinameSwazilandSwedenSwitzerlandSyrian Arab RepublicTajikistanTanzaniaThailandTimor-LesteTogoTongaTrinidad and TobagoTunisiaTurkeyTurks and Caicos IslandsUgandaUkraineUnited Arab EmiratesUnited KingdomUnited StatesUpper middle incomeUruguayUzbekistanVanuatuVenezuela, RBVietnamVirgin Islands (U.S.)West Bank and GazaWorldYemen, Rep.ZambiaZimbabwe Timeline:
This timeline shows a graph from 1971 to 2015 of Latin America & Caribbean (excluding high income). No data until 1970. Number of actual observations by date: 45.
Source name:
World Development Indicators
Source organization:
UNESCO Institute for Statistics
Categories, topics:
Education
Last updated:
apr 23, 2017
Indicators value changes by year
Minimum:
362.535K
jan 1, 1971
Maximum:
2.207 mln
jan 1, 2006
At the date of observation
Value
Absolute change
Change from previous value
jan 1, 1971
362.535K
+362.535K
0.0%
jan 1, 1972
388.256K
+25.721K
7.09%
jan 1, 1973
443.37K
+55.114K
14.2%
jan 1, 1974
480.261K
+36.891K
8.32%
jan 1, 1975
575.021K
+94.76K
19.73%
jan 1, 1976
615.609K
+40.587K
7.06%
jan 1, 1977
675.121K
+59.512K
9.67%
jan 1, 1978
733.899K
+58.778K
8.71%
jan 1, 1979
764.92K
+31.021K
4.23%
jan 1, 1980
1.247 mln
+481.614K
62.96%
jan 1, 1981
1.273 mln
+26.439K
2.12%
jan 1, 1982
1.299 mln
+25.624K
2.01%
jan 1, 1983
1.329 mln
+30.033K
2.31%
jan 1, 1984
1.359 mln
+30.443K
2.29%
jan 1, 1985
1.397 mln
+38.096K
2.8%
jan 1, 1986
938.515K
-458.653K
-32.83%
jan 1, 1987
1.486 mln
+547.006K
58.28%
jan 1, 1988
1.536 mln
+50.171K
3.38%
jan 1, 1989
1.577 mln
+40.91K
2.66%
jan 1, 1990
1.609 mln
+32.219K
2.04%
jan 1, 1991
1.64 mln
+31.344K
1.95%
jan 1, 1992
1.668 mln
+27.944K
1.7%
jan 1, 1993
1.695 mln
+26.918K
1.61%
jan 1, 1994
1.723 mln
+27.714K
1.64%
jan 1, 1995
1.754 mln
+31.627K
1.84%
jan 1, 1996
1.781 mln
+26.439K
1.51%
jan 1, 1997
1.829 mln
+48.311K
2.71%
jan 1, 1998
1.849 mln
+19.937K
1.09%
jan 1, 1999
1.916 mln
+66.595K
3.6%
jan 1, 2000
1.914 mln
-1.859K
-0.1%
jan 1, 2001
1.99 mln
+76.079K
3.98%
jan 1, 2002
1.862 mln
-127.633K
-6.41%
jan 1, 2003
1.939 mln
+76.757K
4.12%
jan 1, 2004
2.063 mln
+123.945K
6.39%
jan 1, 2005
2.128 mln
+64.669K
3.13%
jan 1, 2006
2.207 mln
+79.18K
3.72%
jan 1, 2007
2.014 mln
-192.362K
-8.72%
jan 1, 2008
1.849 mln
-165.132K
-8.2%
jan 1, 2009
1.953 mln
+103.763K
5.61%
jan 1, 2010
1.995 mln
+42.22K
2.16%
jan 1, 2011
2.045 mln
+49.456K
2.48%
jan 1, 2012
2.076 mln
+30.769K
1.5%
jan 1, 2013
2.102 mln
+26.795K
1.29%
jan 1, 2014
2.147 mln
+45.027K
2.14%
jan 1, 2015
2.195 mln
+47.985K
2.23%
Ranking of countries by current statistics by years


Comments: