29
/
en
AIzaSyAYiBZKx7MnpbEhh9jyipgxe19OcubqV5w
April 1, 2024
277672
Uruguay
URY
true
2
1
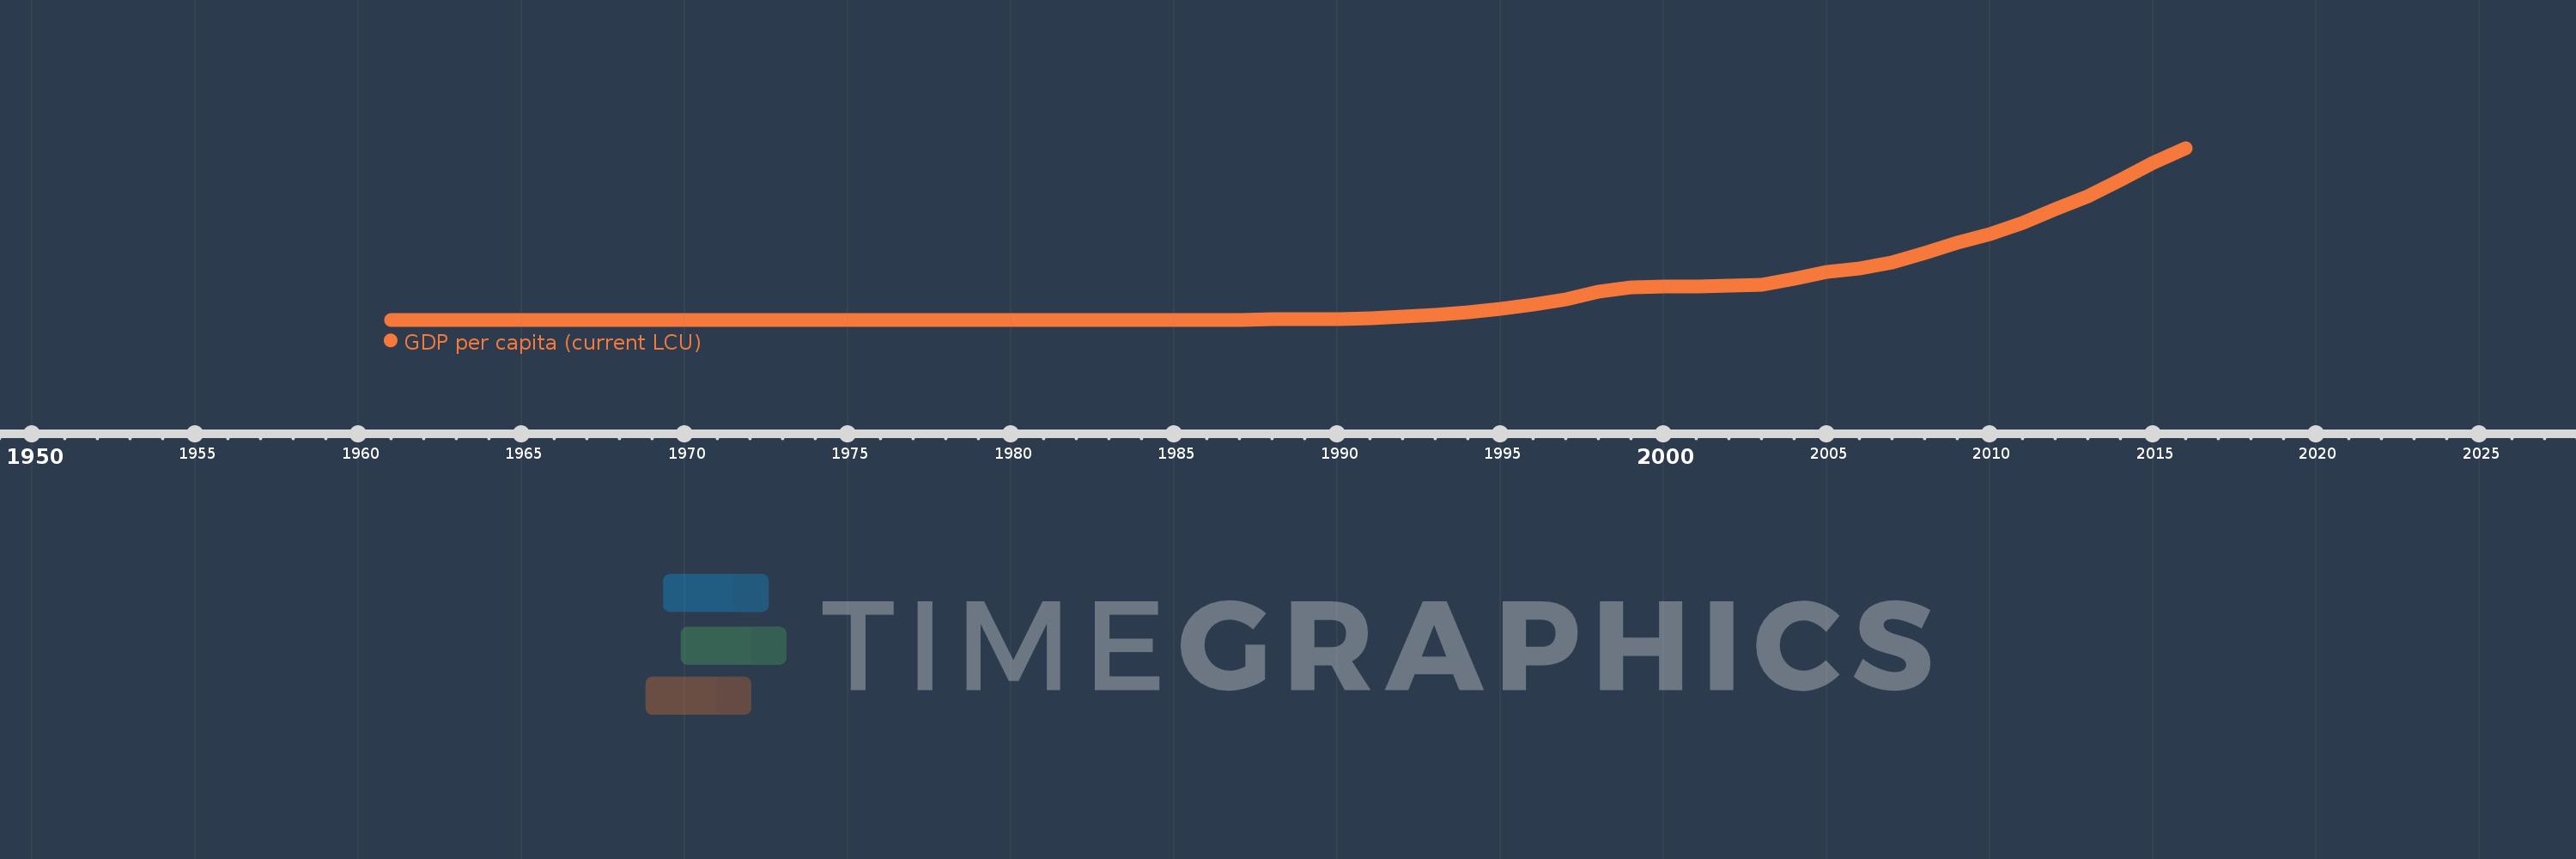
GDP per capita (current LCU)
2016,2015,2014,2013,2012,2011,2010,2009,2008,2007,2006,2005,2004,2003,2002,2001,2000,1999,1998,1997,1996,1995,1994,1993,1992,1991,1990,1989,1988,1987,1986,1985,1984,1983,1982,1981,1980,1979,1978,1977,1976,1975,1974,1973,1972,1971,1970,1969,1968,1967,1966,1965,1964,1963,1962,1961
This statistics in other country:
AfghanistanAlbaniaAlgeriaAndorraAngolaAntigua and BarbudaArgentinaArmeniaArubaAustraliaAustriaAzerbaijanBahamas, TheBahrainBangladeshBarbadosBelarusBelgiumBelizeBeninBermudaBhutanBoliviaBosnia and HerzegovinaBotswanaBrazilBrunei DarussalamBulgariaBurkina FasoBurundiCabo VerdeCambodiaCameroonCanadaCayman IslandsCentral African RepublicChadChannel IslandsChileChinaColombiaComorosCongo, Dem. Rep.Congo, Rep.Costa RicaCote d'IvoireCroatiaCubaCyprusCzech RepublicDenmarkDjiboutiDominicaDominican RepublicEcuadorEgypt, Arab Rep.El SalvadorEquatorial GuineaEritreaEstoniaEthiopiaFaroe IslandsFijiFinlandFranceFrench PolynesiaGabonGambia, TheGeorgiaGermanyGhanaGreeceGreenlandGrenadaGuatemalaGuineaGuinea-BissauGuyanaHaitiHondurasHong Kong SAR, ChinaHungaryIcelandIndiaIndonesiaIran, Islamic Rep.IraqIrelandIsle of ManIsraelItalyJamaicaJapanJordanKazakhstanKenyaKiribatiKorea, Rep.KosovoKuwaitKyrgyz RepublicLao PDRLatviaLebanonLesothoLiberiaLibyaLiechtensteinLithuaniaLuxembourgMacao SAR, ChinaMacedonia, FYRMadagascarMalawiMalaysiaMaldivesMaliMaltaMarshall IslandsMauritaniaMauritiusMexicoMicronesia, Fed. Sts.MoldovaMonacoMongoliaMontenegroMoroccoMozambiqueMyanmarNamibiaNauruNepalNetherlandsNew CaledoniaNew ZealandNicaraguaNigerNigeriaNorwayOmanPakistanPalauPanamaPapua New GuineaParaguayPeruPhilippinesPolandPortugalPuerto RicoQatarRomaniaRussian FederationRwandaSamoaSan MarinoSao Tome and PrincipeSaudi ArabiaSenegalSerbiaSeychellesSierra LeoneSingaporeSint Maarten (Dutch part)Slovak RepublicSloveniaSolomon IslandsSomaliaSouth AfricaSouth SudanSpainSri LankaSt. Kitts and NevisSt. LuciaSt. Vincent and the GrenadinesSudanSurinameSwazilandSwedenSwitzerlandSyrian Arab RepublicTajikistanTanzaniaThailandTimor-LesteTogoTongaTrinidad and TobagoTunisiaTurkeyTurkmenistanTuvaluUgandaUkraineUnited Arab EmiratesUnited KingdomUnited StatesUruguayUzbekistanVanuatuVenezuela, RBVietnamVirgin Islands (U.S.)West Bank and GazaYemen, Rep.ZambiaZimbabwe Timeline:
This timeline shows a graph from 1961 to 2016 of Uruguay. No data until 1960. Number of actual observations by date: 56.
Source name:
World Development Indicators
Source organization:
World Bank national accounts data, and OECD National Accounts data files.
Categories, topics:
Economy & Growth
Last updated:
apr 23, 2017
Indicators value changes by year
Maximum:
425.591K
jan 1, 2016
At the date of observation
Value
Absolute change
Change from previous value
jan 1, 1961
0.006
+0.006
0.0%
jan 1, 1962
0.007
+0.001
19.82%
jan 1, 1963
0.007
+0.001
8.86%
jan 1, 1964
0.009
+0.001
18.68%
jan 1, 1965
0.013
+0.004
42.14%
jan 1, 1966
0.02
+0.008
62.11%
jan 1, 1967
0.036
+0.015
75.75%
jan 1, 1968
0.061
+0.025
70.3%
jan 1, 1969
0.133
+0.072
118.37%
jan 1, 1970
0.178
+0.045
33.56%
jan 1, 1971
0.189
+0.011
6.06%
jan 1, 1972
0.247
+0.058
30.96%
jan 1, 1973
0.412
+0.165
66.75%
jan 1, 1974
1.204
+0.792
192.31%
jan 1, 1975
1.591
+0.387
32.11%
jan 1, 1976
2.795
+1.204
75.72%
jan 1, 1977
4.262
+1.467
52.48%
jan 1, 1978
6.692
+2.43
57.01%
jan 1, 1979
10.284
+3.592
53.68%
jan 1, 1980
19.436
+9.153
89.0%
jan 1, 1981
31.622
+12.186
62.7%
jan 1, 1982
40.629
+9.007
28.48%
jan 1, 1983
43.042
+2.412
5.94%
jan 1, 1984
58.987
+15.945
37.05%
jan 1, 1985
90.587
+31.601
53.57%
jan 1, 1986
158.927
+68.339
75.44%
jan 1, 1987
293.777
+134.851
84.85%
jan 1, 1988
544.771
+250.994
85.44%
jan 1, 1989
959.44
+414.668
76.12%
jan 1, 1990
1.697K
+737.587
76.88%
jan 1, 1991
3.497K
+1.8K
106.05%
jan 1, 1992
7.219K
+3.722K
106.45%
jan 1, 1993
12.347K
+5.128K
71.04%
jan 1, 1994
18.603K
+6.256K
50.67%
jan 1, 1995
27.53K
+8.927K
47.98%
jan 1, 1996
37.993K
+10.463K
38.01%
jan 1, 1997
50.352K
+12.359K
32.53%
jan 1, 1998
69.189K
+18.837K
37.41%
jan 1, 1999
80.75K
+11.561K
16.71%
jan 1, 2000
82.18K
+1.431K
1.77%
jan 1, 2001
83.147K
+966.866
1.18%
jan 1, 2002
83.662K
+514.95
0.62%
jan 1, 2003
86.915K
+3.253K
3.89%
jan 1, 2004
102.173K
+15.258K
17.56%
jan 1, 2005
118.182K
+16.009K
15.67%
jan 1, 2006
127.802K
+9.619K
8.14%
jan 1, 2007
141.501K
+13.699K
10.72%
jan 1, 2008
164.524K
+23.024K
16.27%
jan 1, 2009
189.849K
+25.324K
15.39%
jan 1, 2010
212.481K
+22.633K
11.92%
jan 1, 2011
239.472K
+26.991K
12.7%
jan 1, 2012
273.616K
+34.143K
14.26%
jan 1, 2013
306.531K
+32.915K
12.03%
jan 1, 2014
345.758K
+39.227K
12.8%
jan 1, 2015
389.093K
+43.335K
12.53%
jan 1, 2016
425.591K
+36.499K
9.38%
Ranking of countries by current statistics by years


Comments: