29
/
en
AIzaSyAYiBZKx7MnpbEhh9jyipgxe19OcubqV5w
April 1, 2024
283223
Virgin Islands (U.S.)
VIR
true
2
1
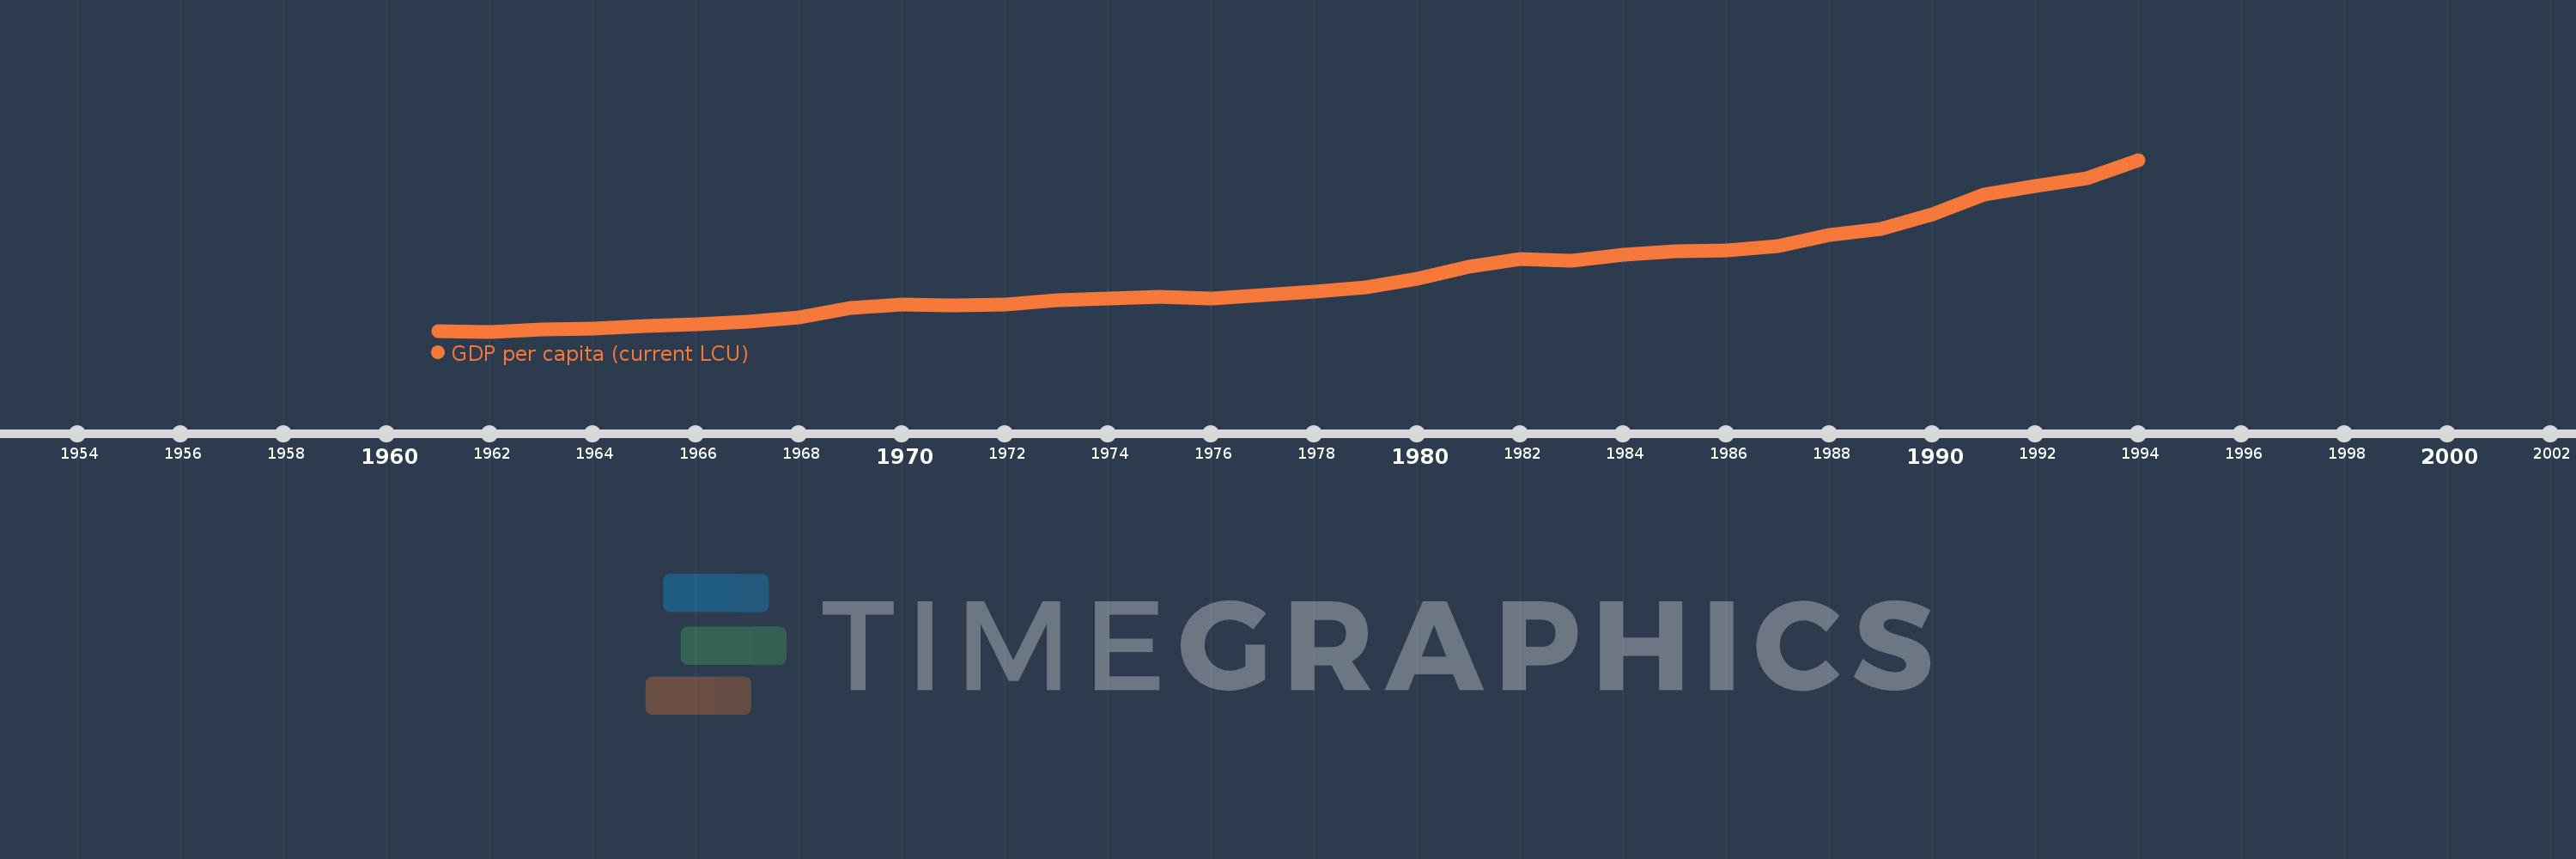
GDP per capita (current LCU)
1994,1993,1992,1991,1990,1989,1988,1987,1986,1985,1984,1983,1982,1981,1980,1979,1978,1977,1976,1975,1974,1973,1972,1971,1970,1969,1968,1967,1966,1965,1964,1963,1962,1961
This statistics in other country:
AfghanistanAlbaniaAlgeriaAndorraAngolaAntigua and BarbudaArgentinaArmeniaArubaAustraliaAustriaAzerbaijanBahamas, TheBahrainBangladeshBarbadosBelarusBelgiumBelizeBeninBermudaBhutanBoliviaBosnia and HerzegovinaBotswanaBrazilBrunei DarussalamBulgariaBurkina FasoBurundiCabo VerdeCambodiaCameroonCanadaCayman IslandsCentral African RepublicChadChannel IslandsChileChinaColombiaComorosCongo, Dem. Rep.Congo, Rep.Costa RicaCote d'IvoireCroatiaCubaCyprusCzech RepublicDenmarkDjiboutiDominicaDominican RepublicEcuadorEgypt, Arab Rep.El SalvadorEquatorial GuineaEritreaEstoniaEthiopiaFaroe IslandsFijiFinlandFranceFrench PolynesiaGabonGambia, TheGeorgiaGermanyGhanaGreeceGreenlandGrenadaGuatemalaGuineaGuinea-BissauGuyanaHaitiHondurasHong Kong SAR, ChinaHungaryIcelandIndiaIndonesiaIran, Islamic Rep.IraqIrelandIsle of ManIsraelItalyJamaicaJapanJordanKazakhstanKenyaKiribatiKorea, Rep.KosovoKuwaitKyrgyz RepublicLao PDRLatviaLebanonLesothoLiberiaLibyaLiechtensteinLithuaniaLuxembourgMacao SAR, ChinaMacedonia, FYRMadagascarMalawiMalaysiaMaldivesMaliMaltaMarshall IslandsMauritaniaMauritiusMexicoMicronesia, Fed. Sts.MoldovaMonacoMongoliaMontenegroMoroccoMozambiqueMyanmarNamibiaNauruNepalNetherlandsNew CaledoniaNew ZealandNicaraguaNigerNigeriaNorwayOmanPakistanPalauPanamaPapua New GuineaParaguayPeruPhilippinesPolandPortugalPuerto RicoQatarRomaniaRussian FederationRwandaSamoaSan MarinoSao Tome and PrincipeSaudi ArabiaSenegalSerbiaSeychellesSierra LeoneSingaporeSint Maarten (Dutch part)Slovak RepublicSloveniaSolomon IslandsSomaliaSouth AfricaSouth SudanSpainSri LankaSt. Kitts and NevisSt. LuciaSt. Vincent and the GrenadinesSudanSurinameSwazilandSwedenSwitzerlandSyrian Arab RepublicTajikistanTanzaniaThailandTimor-LesteTogoTongaTrinidad and TobagoTunisiaTurkeyTurkmenistanTuvaluUgandaUkraineUnited Arab EmiratesUnited KingdomUnited StatesUruguayUzbekistanVanuatuVenezuela, RBVietnamVirgin Islands (U.S.)West Bank and GazaYemen, Rep.ZambiaZimbabwe Timeline:
This timeline shows a graph from 1961 to 1994 of Virgin Islands (U.S.). No data until 1960. Number of actual observations by date: 34.
Source name:
World Development Indicators
Source organization:
World Bank national accounts data, and OECD National Accounts data files.
Categories, topics:
Economy & Growth
Last updated:
apr 23, 2017
Indicators value changes by year
Minimum:
753.666
jan 1, 1962
Maximum:
18.728K
jan 1, 1994
At the date of observation
Value
Absolute change
Change from previous value
jan 1, 1961
756.25
+756.25
0.0%
jan 1, 1962
753.666
-2.584
-0.34%
jan 1, 1963
1.017K
+262.863
34.88%
jan 1, 1964
1.07K
+53.239
5.24%
jan 1, 1965
1.303K
+232.896
21.77%
jan 1, 1966
1.511K
+208.7
16.02%
jan 1, 1967
1.778K
+266.649
17.64%
jan 1, 1968
2.272K
+493.641
27.76%
jan 1, 1969
3.183K
+911.497
40.12%
jan 1, 1970
3.606K
+422.652
13.28%
jan 1, 1971
3.476K
-129.612
-3.59%
jan 1, 1972
3.62K
+143.528
4.13%
jan 1, 1973
4.041K
+421.071
11.63%
jan 1, 1974
4.186K
+144.925
3.59%
jan 1, 1975
4.393K
+207.619
4.96%
jan 1, 1976
4.253K
-140.142
-3.19%
jan 1, 1977
4.583K
+330.142
7.76%
jan 1, 1978
4.966K
+382.258
8.34%
jan 1, 1979
5.343K
+377.117
7.59%
jan 1, 1980
6.32K
+977.084
18.29%
jan 1, 1981
7.503K
+1.183K
18.72%
jan 1, 1982
8.386K
+882.622
11.76%
jan 1, 1983
8.163K
-222.969
-2.66%
jan 1, 1984
8.816K
+653.601
8.01%
jan 1, 1985
9.124K
+307.728
3.49%
jan 1, 1986
9.256K
+132.001
1.45%
jan 1, 1987
9.724K
+467.869
5.05%
jan 1, 1988
10.828K
+1.104K
11.36%
jan 1, 1989
11.527K
+698.971
6.46%
jan 1, 1990
13.048K
+1.52K
13.19%
jan 1, 1991
15.051K
+2.003K
15.35%
jan 1, 1992
15.945K
+894.953
5.95%
jan 1, 1993
16.752K
+806.777
5.06%
jan 1, 1994
18.728K
+1.976K
11.8%
Ranking of countries by current statistics by years


Comments: