29
/
en
AIzaSyAYiBZKx7MnpbEhh9jyipgxe19OcubqV5w
April 1, 2024
283618
West Bank and Gaza
PSE
true
2
1
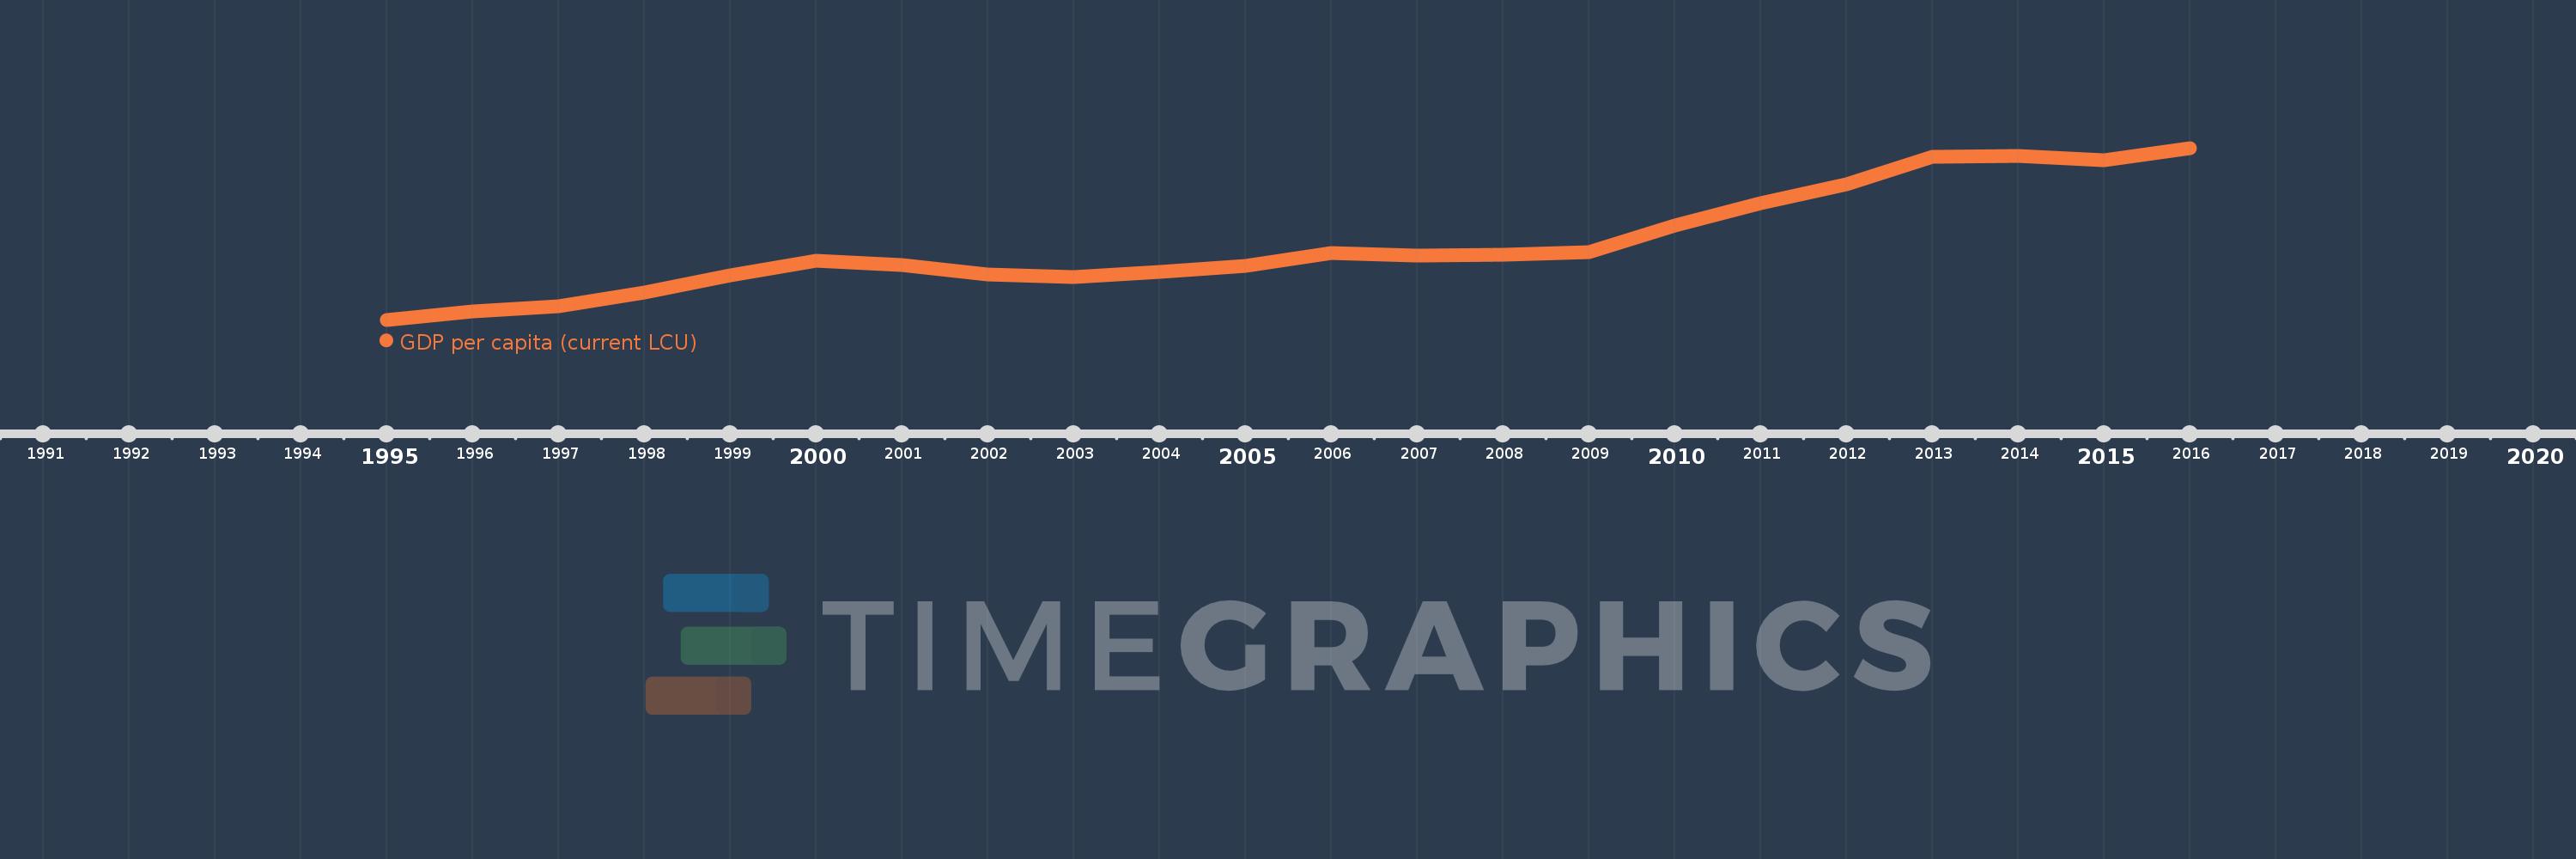
GDP per capita (current LCU)
2016,2015,2014,2013,2012,2011,2010,2009,2008,2007,2006,2005,2004,2003,2002,2001,2000,1999,1998,1997,1996,1995
This statistics in other country:
AfghanistanAlbaniaAlgeriaAndorraAngolaAntigua and BarbudaArgentinaArmeniaArubaAustraliaAustriaAzerbaijanBahamas, TheBahrainBangladeshBarbadosBelarusBelgiumBelizeBeninBermudaBhutanBoliviaBosnia and HerzegovinaBotswanaBrazilBrunei DarussalamBulgariaBurkina FasoBurundiCabo VerdeCambodiaCameroonCanadaCayman IslandsCentral African RepublicChadChannel IslandsChileChinaColombiaComorosCongo, Dem. Rep.Congo, Rep.Costa RicaCote d'IvoireCroatiaCubaCyprusCzech RepublicDenmarkDjiboutiDominicaDominican RepublicEcuadorEgypt, Arab Rep.El SalvadorEquatorial GuineaEritreaEstoniaEthiopiaFaroe IslandsFijiFinlandFranceFrench PolynesiaGabonGambia, TheGeorgiaGermanyGhanaGreeceGreenlandGrenadaGuatemalaGuineaGuinea-BissauGuyanaHaitiHondurasHong Kong SAR, ChinaHungaryIcelandIndiaIndonesiaIran, Islamic Rep.IraqIrelandIsle of ManIsraelItalyJamaicaJapanJordanKazakhstanKenyaKiribatiKorea, Rep.KosovoKuwaitKyrgyz RepublicLao PDRLatviaLebanonLesothoLiberiaLibyaLiechtensteinLithuaniaLuxembourgMacao SAR, ChinaMacedonia, FYRMadagascarMalawiMalaysiaMaldivesMaliMaltaMarshall IslandsMauritaniaMauritiusMexicoMicronesia, Fed. Sts.MoldovaMonacoMongoliaMontenegroMoroccoMozambiqueMyanmarNamibiaNauruNepalNetherlandsNew CaledoniaNew ZealandNicaraguaNigerNigeriaNorwayOmanPakistanPalauPanamaPapua New GuineaParaguayPeruPhilippinesPolandPortugalPuerto RicoQatarRomaniaRussian FederationRwandaSamoaSan MarinoSao Tome and PrincipeSaudi ArabiaSenegalSerbiaSeychellesSierra LeoneSingaporeSint Maarten (Dutch part)Slovak RepublicSloveniaSolomon IslandsSomaliaSouth AfricaSouth SudanSpainSri LankaSt. Kitts and NevisSt. LuciaSt. Vincent and the GrenadinesSudanSurinameSwazilandSwedenSwitzerlandSyrian Arab RepublicTajikistanTanzaniaThailandTimor-LesteTogoTongaTrinidad and TobagoTunisiaTurkeyTurkmenistanTuvaluUgandaUkraineUnited Arab EmiratesUnited KingdomUnited StatesUruguayUzbekistanVanuatuVenezuela, RBVietnamVirgin Islands (U.S.)West Bank and GazaYemen, Rep.ZambiaZimbabwe Timeline:
This timeline shows a graph from 1995 to 2016 of West Bank and Gaza. No data until 1994. Number of actual observations by date: 22.
Source name:
World Development Indicators
Source organization:
World Bank national accounts data, and OECD National Accounts data files.
Categories, topics:
Economy & Growth
Last updated:
apr 23, 2017
Indicators value changes by year
Minimum:
3.618K
jan 1, 1995
Maximum:
11.143K
jan 1, 2016
At the date of observation
Value
Absolute change
Change from previous value
jan 1, 1995
3.618K
+3.618K
0.0%
jan 1, 1996
3.995K
+376.597
10.41%
jan 1, 1997
4.205K
+210.28
5.26%
jan 1, 1998
4.792K
+587.244
13.97%
jan 1, 1999
5.567K
+775.119
16.17%
jan 1, 2000
6.207K
+640.126
11.5%
jan 1, 2001
6.019K
-188.652
-3.04%
jan 1, 2002
5.617K
-401.859
-6.68%
jan 1, 2003
5.478K
-139.009
-2.47%
jan 1, 2004
5.723K
+244.601
4.47%
jan 1, 2005
5.995K
+272.441
4.76%
jan 1, 2006
6.53K
+535.477
8.93%
jan 1, 2007
6.423K
-107.582
-1.65%
jan 1, 2008
6.473K
+49.707
0.77%
jan 1, 2009
6.568K
+95.746
1.48%
jan 1, 2010
7.735K
+1.167K
17.76%
jan 1, 2011
8.723K
+988.411
12.78%
jan 1, 2012
9.535K
+812.037
9.31%
jan 1, 2013
10.747K
+1.212K
12.71%
jan 1, 2014
10.804K
+57.192
0.53%
jan 1, 2015
10.593K
-210.872
-1.95%
jan 1, 2016
11.143K
+549.311
5.19%
Ranking of countries by current statistics by years


Comments: