29
/
en
AIzaSyAYiBZKx7MnpbEhh9jyipgxe19OcubqV5w
April 1, 2024
219577
Papua New Guinea
PNG
true
2
1
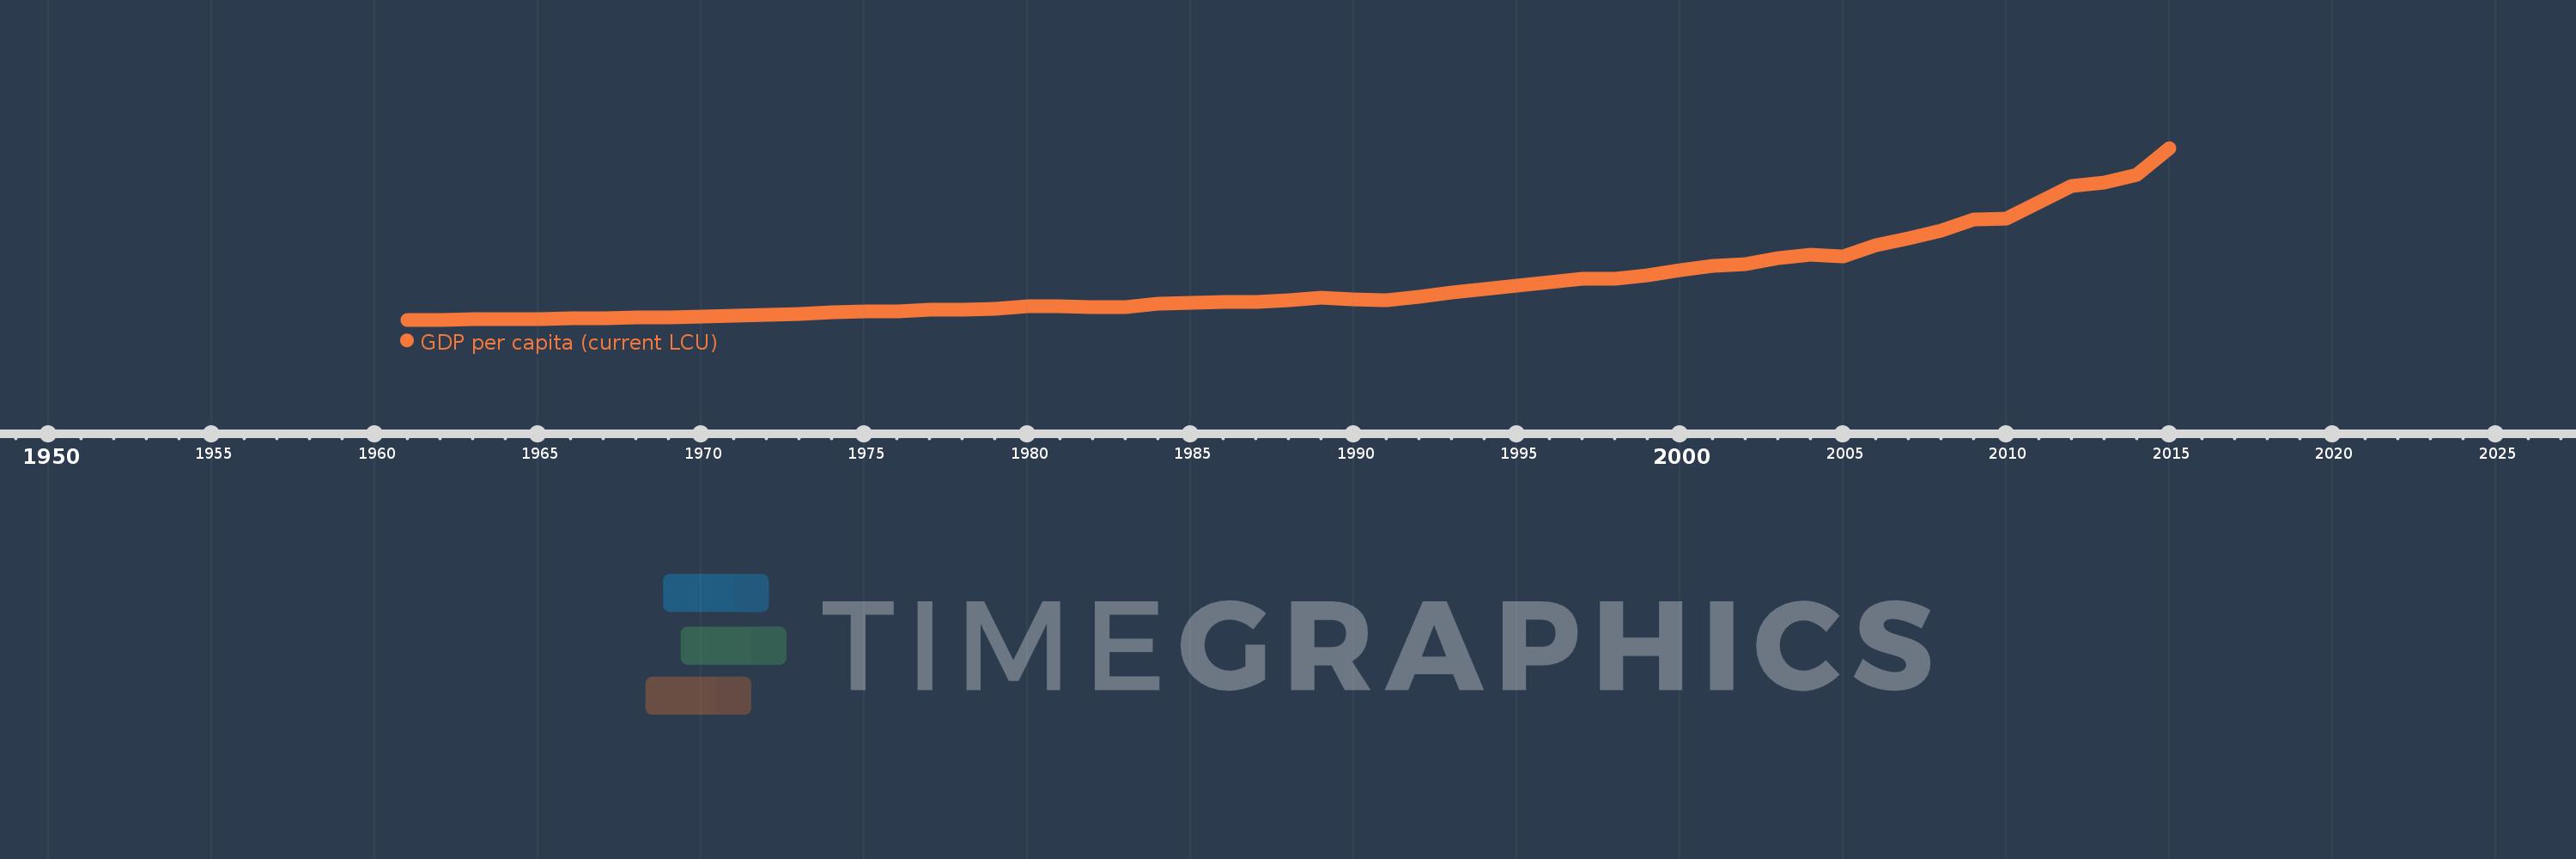
GDP per capita (current LCU)
2015,2014,2013,2012,2011,2010,2009,2008,2007,2006,2005,2004,2003,2002,2001,2000,1999,1998,1997,1996,1995,1994,1993,1992,1991,1990,1989,1988,1987,1986,1985,1984,1983,1982,1981,1980,1979,1978,1977,1976,1975,1974,1973,1972,1971,1970,1969,1968,1967,1966,1965,1964,1963,1962,1961
This statistics in other country:
AfghanistanAlbaniaAlgeriaAndorraAngolaAntigua and BarbudaArgentinaArmeniaArubaAustraliaAustriaAzerbaijanBahamas, TheBahrainBangladeshBarbadosBelarusBelgiumBelizeBeninBermudaBhutanBoliviaBosnia and HerzegovinaBotswanaBrazilBrunei DarussalamBulgariaBurkina FasoBurundiCabo VerdeCambodiaCameroonCanadaCayman IslandsCentral African RepublicChadChannel IslandsChileChinaColombiaComorosCongo, Dem. Rep.Congo, Rep.Costa RicaCote d'IvoireCroatiaCubaCyprusCzech RepublicDenmarkDjiboutiDominicaDominican RepublicEcuadorEgypt, Arab Rep.El SalvadorEquatorial GuineaEritreaEstoniaEthiopiaFaroe IslandsFijiFinlandFranceFrench PolynesiaGabonGambia, TheGeorgiaGermanyGhanaGreeceGreenlandGrenadaGuatemalaGuineaGuinea-BissauGuyanaHaitiHondurasHong Kong SAR, ChinaHungaryIcelandIndiaIndonesiaIran, Islamic Rep.IraqIrelandIsle of ManIsraelItalyJamaicaJapanJordanKazakhstanKenyaKiribatiKorea, Rep.KosovoKuwaitKyrgyz RepublicLao PDRLatviaLebanonLesothoLiberiaLibyaLiechtensteinLithuaniaLuxembourgMacao SAR, ChinaMacedonia, FYRMadagascarMalawiMalaysiaMaldivesMaliMaltaMarshall IslandsMauritaniaMauritiusMexicoMicronesia, Fed. Sts.MoldovaMonacoMongoliaMontenegroMoroccoMozambiqueMyanmarNamibiaNauruNepalNetherlandsNew CaledoniaNew ZealandNicaraguaNigerNigeriaNorwayOmanPakistanPalauPanamaPapua New GuineaParaguayPeruPhilippinesPolandPortugalPuerto RicoQatarRomaniaRussian FederationRwandaSamoaSan MarinoSao Tome and PrincipeSaudi ArabiaSenegalSerbiaSeychellesSierra LeoneSingaporeSint Maarten (Dutch part)Slovak RepublicSloveniaSolomon IslandsSomaliaSouth AfricaSouth SudanSpainSri LankaSt. Kitts and NevisSt. LuciaSt. Vincent and the GrenadinesSudanSurinameSwazilandSwedenSwitzerlandSyrian Arab RepublicTajikistanTanzaniaThailandTimor-LesteTogoTongaTrinidad and TobagoTunisiaTurkeyTurkmenistanTuvaluUgandaUkraineUnited Arab EmiratesUnited KingdomUnited StatesUruguayUzbekistanVanuatuVenezuela, RBVietnamVirgin Islands (U.S.)West Bank and GazaYemen, Rep.ZambiaZimbabwe Timeline:
This timeline shows a graph from 1961 to 2015 of Papua New Guinea. No data until 1960. Number of actual observations by date: 55.
Source name:
World Development Indicators
Source organization:
World Bank national accounts data, and OECD National Accounts data files.
Categories, topics:
Economy & Growth
Last updated:
apr 23, 2017
Indicators value changes by year
Minimum:
104.629
jan 1, 1961
Maximum:
5.583K
jan 1, 2015
At the date of observation
Value
Absolute change
Change from previous value
jan 1, 1961
104.629
+104.629
0.0%
jan 1, 1962
109.243
+4.614
4.41%
jan 1, 1963
114.473
+5.23
4.79%
jan 1, 1964
118.711
+4.238
3.7%
jan 1, 1965
128.777
+10.066
8.48%
jan 1, 1966
142.196
+13.419
10.42%
jan 1, 1967
158.077
+15.881
11.17%
jan 1, 1968
174.6
+16.523
10.45%
jan 1, 1969
187.288
+12.688
7.27%
jan 1, 1970
207.547
+20.259
10.82%
jan 1, 1971
236.738
+29.192
14.07%
jan 1, 1972
253.129
+16.39
6.92%
jan 1, 1973
278.367
+25.238
9.97%
jan 1, 1974
344.833
+66.466
23.88%
jan 1, 1975
374.351
+29.518
8.56%
jan 1, 1976
368.83
-5.521
-1.47%
jan 1, 1977
414.955
+46.124
12.51%
jan 1, 1978
437.556
+22.601
5.45%
jan 1, 1979
453.086
+15.529
3.55%
jan 1, 1980
521.577
+68.491
15.12%
jan 1, 1981
531.211
+9.634
1.85%
jan 1, 1982
508.809
-22.402
-4.22%
jan 1, 1983
515.107
+6.298
1.24%
jan 1, 1984
614.002
+98.895
19.2%
jan 1, 1985
640.036
+26.034
4.24%
jan 1, 1986
659.107
+19.072
2.98%
jan 1, 1987
682.022
+22.915
3.48%
jan 1, 1988
738.423
+56.4
8.27%
jan 1, 1989
800.481
+62.059
8.4%
jan 1, 1990
750.652
-49.829
-6.22%
jan 1, 1991
739.844
-10.808
-1.44%
jan 1, 1992
846.001
+106.157
14.35%
jan 1, 1993
966.493
+120.492
14.24%
jan 1, 1994
1.086K
+119.746
12.39%
jan 1, 1995
1.203K
+117.012
10.77%
jan 1, 1996
1.314K
+110.318
9.17%
jan 1, 1997
1.404K
+90.204
6.87%
jan 1, 1998
1.425K
+20.947
1.49%
jan 1, 1999
1.53K
+104.908
7.36%
jan 1, 2000
1.686K
+156.152
10.21%
jan 1, 2001
1.812K
+125.851
7.47%
jan 1, 2002
1.886K
+74.204
4.1%
jan 1, 2003
2.062K
+175.886
9.33%
jan 1, 2004
2.168K
+106.718
5.18%
jan 1, 2005
2.13K
-38.47
-1.77%
jan 1, 2006
2.48K
+349.779
16.42%
jan 1, 2007
2.71K
+229.771
9.27%
jan 1, 2008
2.944K
+234.055
8.64%
jan 1, 2009
3.303K
+359.195
12.2%
jan 1, 2010
3.336K
+33.302
1.01%
jan 1, 2011
3.858K
+522.406
15.66%
jan 1, 2012
4.36K
+501.077
12.99%
jan 1, 2013
4.482K
+122.706
2.81%
jan 1, 2014
4.733K
+251.032
5.6%
jan 1, 2015
5.583K
+849.552
17.95%
Ranking of countries by current statistics by years


Comments: