29
/
en
AIzaSyAYiBZKx7MnpbEhh9jyipgxe19OcubqV5w
April 1, 2024
124801
Egypt, Arab Rep.
EGY
true
2
1
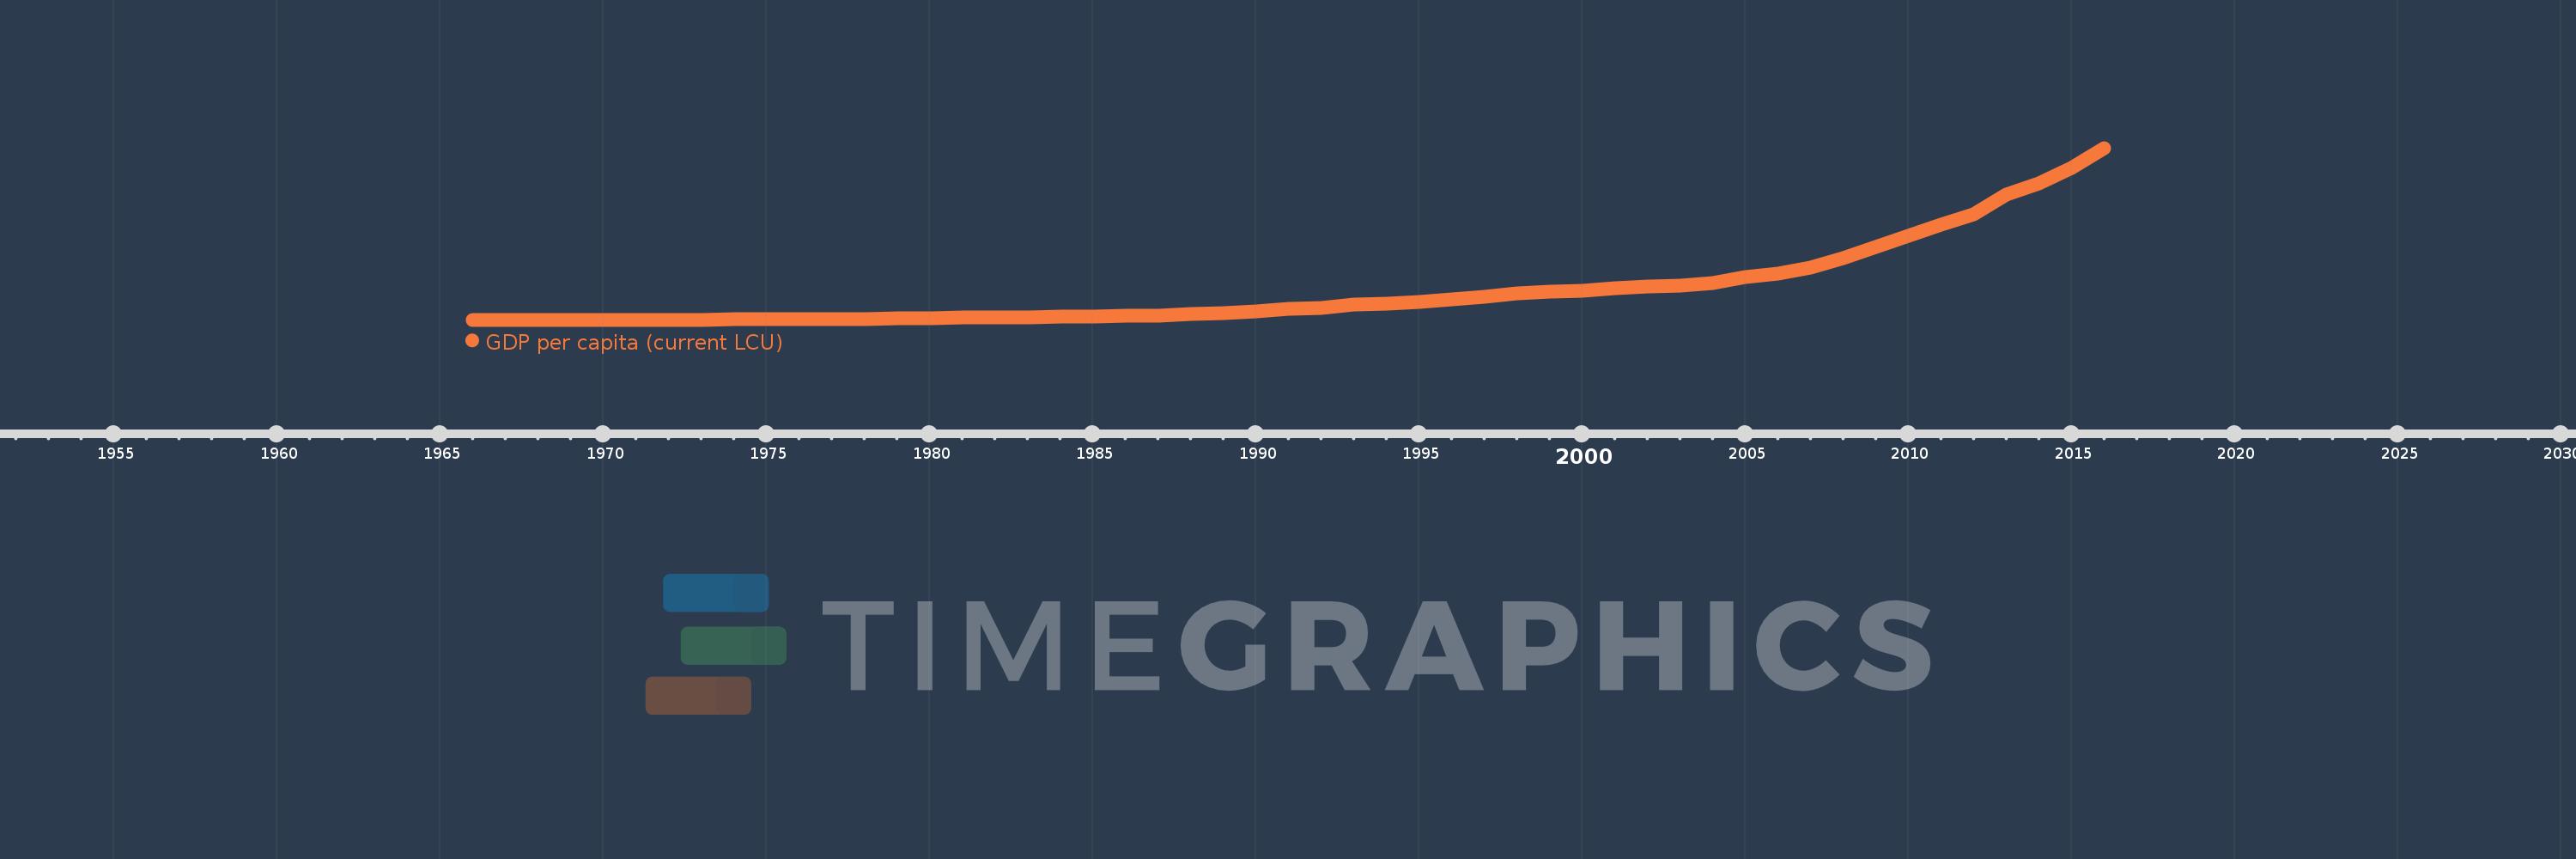
GDP per capita (current LCU)
2016,2015,2014,2013,2012,2011,2010,2009,2008,2007,2006,2005,2004,2003,2002,2001,2000,1999,1998,1997,1996,1995,1994,1993,1992,1991,1990,1989,1988,1987,1986,1985,1984,1983,1982,1981,1980,1979,1978,1977,1976,1975,1974,1973,1972,1971,1970,1969,1968,1967,1966
This statistics in other country:
AfghanistanAlbaniaAlgeriaAndorraAngolaAntigua and BarbudaArgentinaArmeniaArubaAustraliaAustriaAzerbaijanBahamas, TheBahrainBangladeshBarbadosBelarusBelgiumBelizeBeninBermudaBhutanBoliviaBosnia and HerzegovinaBotswanaBrazilBrunei DarussalamBulgariaBurkina FasoBurundiCabo VerdeCambodiaCameroonCanadaCayman IslandsCentral African RepublicChadChannel IslandsChileChinaColombiaComorosCongo, Dem. Rep.Congo, Rep.Costa RicaCote d'IvoireCroatiaCubaCyprusCzech RepublicDenmarkDjiboutiDominicaDominican RepublicEcuadorEgypt, Arab Rep.El SalvadorEquatorial GuineaEritreaEstoniaEthiopiaFaroe IslandsFijiFinlandFranceFrench PolynesiaGabonGambia, TheGeorgiaGermanyGhanaGreeceGreenlandGrenadaGuatemalaGuineaGuinea-BissauGuyanaHaitiHondurasHong Kong SAR, ChinaHungaryIcelandIndiaIndonesiaIran, Islamic Rep.IraqIrelandIsle of ManIsraelItalyJamaicaJapanJordanKazakhstanKenyaKiribatiKorea, Rep.KosovoKuwaitKyrgyz RepublicLao PDRLatviaLebanonLesothoLiberiaLibyaLiechtensteinLithuaniaLuxembourgMacao SAR, ChinaMacedonia, FYRMadagascarMalawiMalaysiaMaldivesMaliMaltaMarshall IslandsMauritaniaMauritiusMexicoMicronesia, Fed. Sts.MoldovaMonacoMongoliaMontenegroMoroccoMozambiqueMyanmarNamibiaNauruNepalNetherlandsNew CaledoniaNew ZealandNicaraguaNigerNigeriaNorwayOmanPakistanPalauPanamaPapua New GuineaParaguayPeruPhilippinesPolandPortugalPuerto RicoQatarRomaniaRussian FederationRwandaSamoaSan MarinoSao Tome and PrincipeSaudi ArabiaSenegalSerbiaSeychellesSierra LeoneSingaporeSint Maarten (Dutch part)Slovak RepublicSloveniaSolomon IslandsSomaliaSouth AfricaSouth SudanSpainSri LankaSt. Kitts and NevisSt. LuciaSt. Vincent and the GrenadinesSudanSurinameSwazilandSwedenSwitzerlandSyrian Arab RepublicTajikistanTanzaniaThailandTimor-LesteTogoTongaTrinidad and TobagoTunisiaTurkeyTurkmenistanTuvaluUgandaUkraineUnited Arab EmiratesUnited KingdomUnited StatesUruguayUzbekistanVanuatuVenezuela, RBVietnamVirgin Islands (U.S.)West Bank and GazaYemen, Rep.ZambiaZimbabwe Timeline:
This timeline shows a graph from 1966 to 2016 of Egypt, Arab Rep.. No data until 1965. Number of actual observations by date: 51.
Source name:
World Development Indicators
Source organization:
World Bank national accounts data, and OECD National Accounts data files.
Categories, topics:
Economy & Growth
Last updated:
apr 23, 2017
Indicators value changes by year
Minimum:
75.798
jan 1, 1966
Maximum:
26.553K
jan 1, 2016
At the date of observation
Value
Absolute change
Change from previous value
jan 1, 1966
75.798
+75.798
0.0%
jan 1, 1967
78.134
+2.337
3.08%
jan 1, 1968
77.732
-0.403
-0.52%
jan 1, 1969
78.632
+0.901
1.16%
jan 1, 1970
83.257
+4.624
5.88%
jan 1, 1971
87.863
+4.607
5.53%
jan 1, 1972
91.142
+3.278
3.73%
jan 1, 1973
93.38
+2.238
2.46%
jan 1, 1974
102.743
+9.363
10.03%
jan 1, 1975
114.741
+11.998
11.68%
jan 1, 1976
135.096
+20.355
17.74%
jan 1, 1977
170.396
+35.3
26.13%
jan 1, 1978
206.649
+36.253
21.28%
jan 1, 1979
237.025
+30.376
14.7%
jan 1, 1980
300.2
+63.176
26.65%
jan 1, 1981
380.382
+80.182
26.71%
jan 1, 1982
389.512
+9.13
2.4%
jan 1, 1983
455.619
+66.108
16.97%
jan 1, 1984
516.373
+60.754
13.33%
jan 1, 1985
593.073
+76.7
14.85%
jan 1, 1986
671.044
+77.971
13.15%
jan 1, 1987
755.81
+84.766
12.63%
jan 1, 1988
988.361
+232.551
30.77%
jan 1, 1989
1.151K
+162.632
16.45%
jan 1, 1990
1.395K
+244.297
21.22%
jan 1, 1991
1.705K
+309.361
22.17%
jan 1, 1992
1.928K
+223.668
13.12%
jan 1, 1993
2.361K
+432.428
22.43%
jan 1, 1994
2.582K
+221.256
9.37%
jan 1, 1995
2.856K
+274.074
10.61%
jan 1, 1996
3.267K
+411.345
14.4%
jan 1, 1997
3.607K
+339.743
10.4%
jan 1, 1998
4.106K
+499.108
13.84%
jan 1, 1999
4.36K
+253.382
6.17%
jan 1, 2000
4.583K
+223.667
5.13%
jan 1, 2001
4.977K
+393.636
8.59%
jan 1, 2002
5.154K
+176.781
3.55%
jan 1, 2003
5.343K
+189.751
3.68%
jan 1, 2004
5.779K
+435.246
8.15%
jan 1, 2005
6.594K
+815.366
14.11%
jan 1, 2006
7.186K
+591.444
8.97%
jan 1, 2007
8.098K
+912.859
12.7%
jan 1, 2008
9.597K
+1.499K
18.51%
jan 1, 2009
11.339K
+1.742K
18.15%
jan 1, 2010
12.956K
+1.617K
14.26%
jan 1, 2011
14.707K
+1.751K
13.52%
jan 1, 2012
16.364K
+1.657K
11.26%
jan 1, 2013
19.339K
+2.975K
18.18%
jan 1, 2014
21.045K
+1.706K
8.82%
jan 1, 2015
23.464K
+2.419K
11.5%
jan 1, 2016
26.553K
+3.089K
13.16%
Ranking of countries by current statistics by years


Comments: