29
/
en
AIzaSyAYiBZKx7MnpbEhh9jyipgxe19OcubqV5w
April 1, 2024
127346
Equatorial Guinea
GNQ
true
2
1
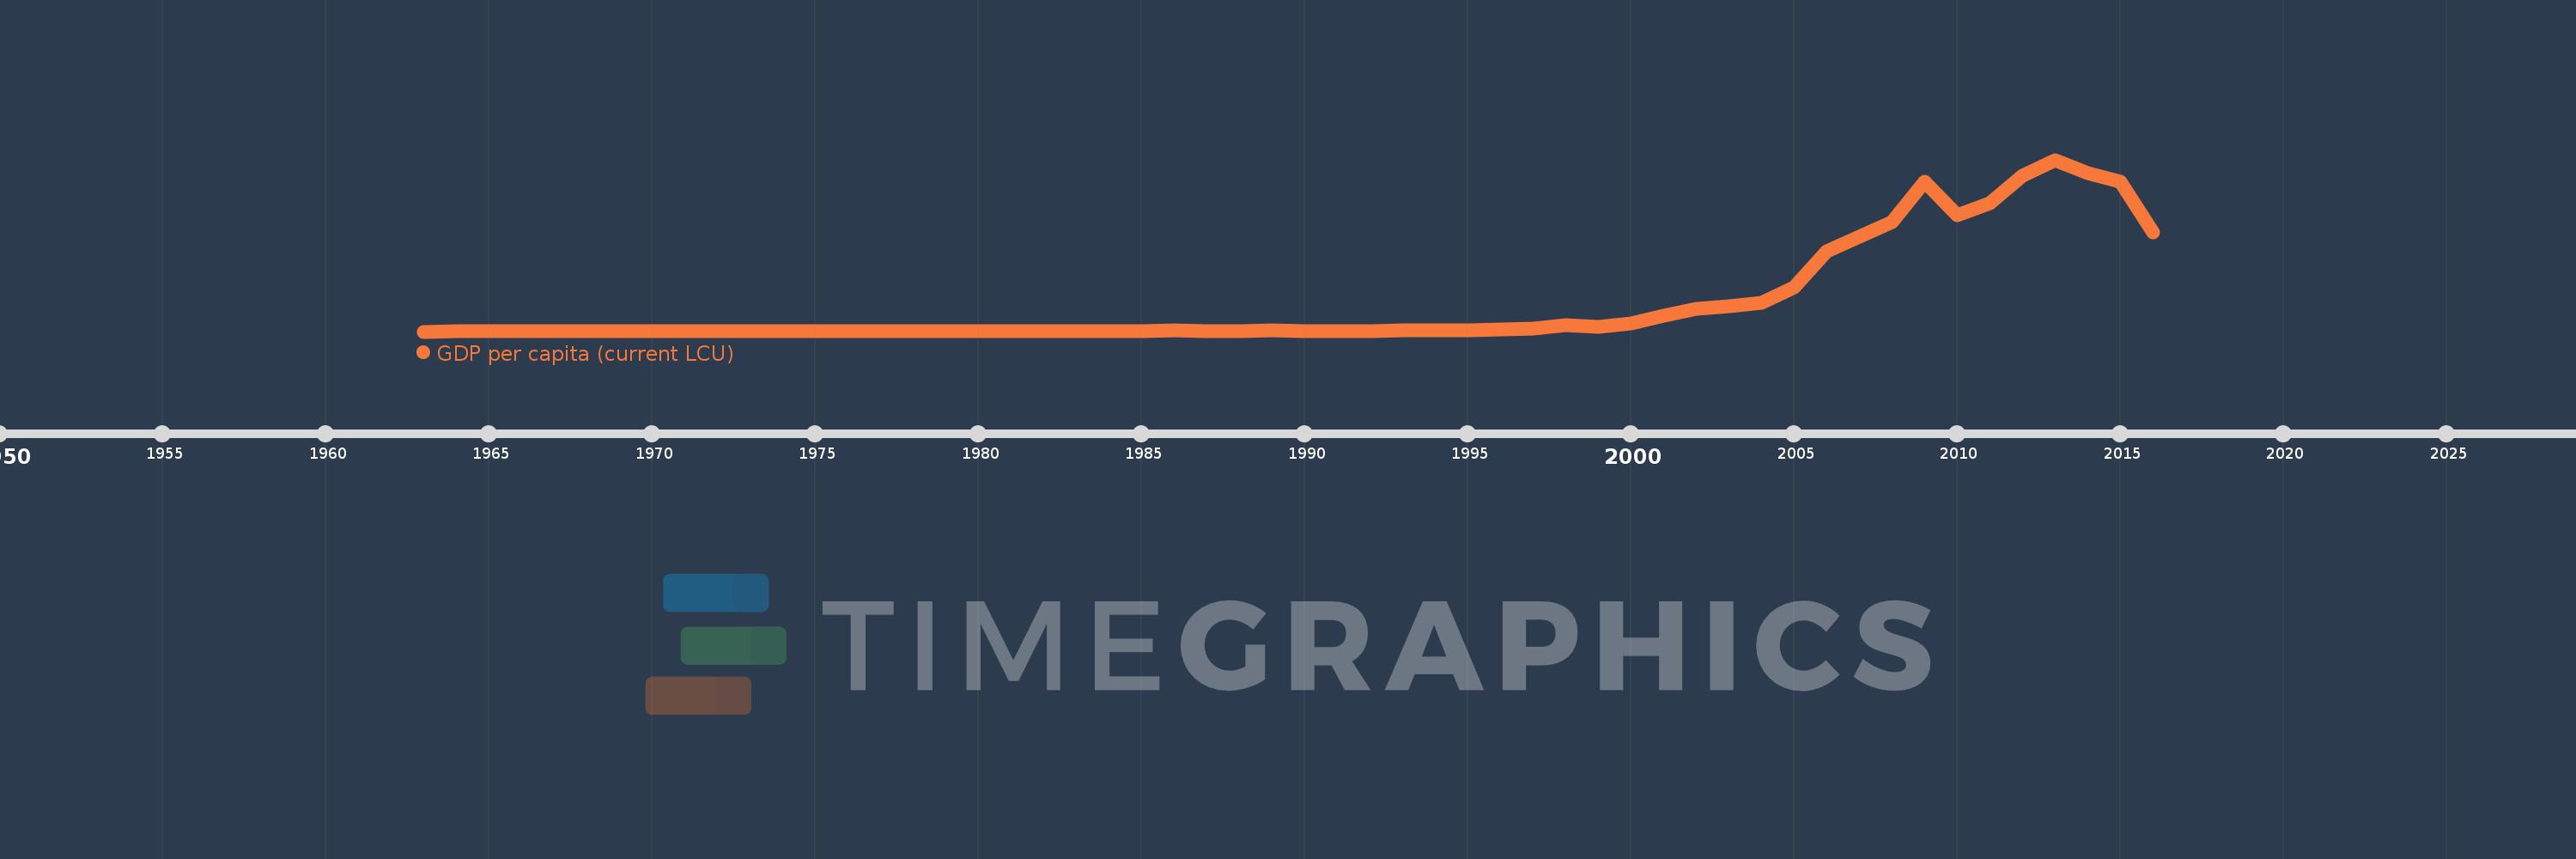
GDP per capita (current LCU)
2016,2015,2014,2013,2012,2011,2010,2009,2008,2007,2006,2005,2004,2003,2002,2001,2000,1999,1998,1997,1996,1995,1994,1993,1992,1991,1990,1989,1988,1987,1986,1985,1984,1983,1982,1981,1978,1977,1976,1975,1974,1973,1972,1971,1970,1969,1968,1967,1966,1965,1964,1963
This statistics in other country:
AfghanistanAlbaniaAlgeriaAndorraAngolaAntigua and BarbudaArgentinaArmeniaArubaAustraliaAustriaAzerbaijanBahamas, TheBahrainBangladeshBarbadosBelarusBelgiumBelizeBeninBermudaBhutanBoliviaBosnia and HerzegovinaBotswanaBrazilBrunei DarussalamBulgariaBurkina FasoBurundiCabo VerdeCambodiaCameroonCanadaCayman IslandsCentral African RepublicChadChannel IslandsChileChinaColombiaComorosCongo, Dem. Rep.Congo, Rep.Costa RicaCote d'IvoireCroatiaCubaCyprusCzech RepublicDenmarkDjiboutiDominicaDominican RepublicEcuadorEgypt, Arab Rep.El SalvadorEquatorial GuineaEritreaEstoniaEthiopiaFaroe IslandsFijiFinlandFranceFrench PolynesiaGabonGambia, TheGeorgiaGermanyGhanaGreeceGreenlandGrenadaGuatemalaGuineaGuinea-BissauGuyanaHaitiHondurasHong Kong SAR, ChinaHungaryIcelandIndiaIndonesiaIran, Islamic Rep.IraqIrelandIsle of ManIsraelItalyJamaicaJapanJordanKazakhstanKenyaKiribatiKorea, Rep.KosovoKuwaitKyrgyz RepublicLao PDRLatviaLebanonLesothoLiberiaLibyaLiechtensteinLithuaniaLuxembourgMacao SAR, ChinaMacedonia, FYRMadagascarMalawiMalaysiaMaldivesMaliMaltaMarshall IslandsMauritaniaMauritiusMexicoMicronesia, Fed. Sts.MoldovaMonacoMongoliaMontenegroMoroccoMozambiqueMyanmarNamibiaNauruNepalNetherlandsNew CaledoniaNew ZealandNicaraguaNigerNigeriaNorwayOmanPakistanPalauPanamaPapua New GuineaParaguayPeruPhilippinesPolandPortugalPuerto RicoQatarRomaniaRussian FederationRwandaSamoaSan MarinoSao Tome and PrincipeSaudi ArabiaSenegalSerbiaSeychellesSierra LeoneSingaporeSint Maarten (Dutch part)Slovak RepublicSloveniaSolomon IslandsSomaliaSouth AfricaSouth SudanSpainSri LankaSt. Kitts and NevisSt. LuciaSt. Vincent and the GrenadinesSudanSurinameSwazilandSwedenSwitzerlandSyrian Arab RepublicTajikistanTanzaniaThailandTimor-LesteTogoTongaTrinidad and TobagoTunisiaTurkeyTurkmenistanTuvaluUgandaUkraineUnited Arab EmiratesUnited KingdomUnited StatesUruguayUzbekistanVanuatuVenezuela, RBVietnamVirgin Islands (U.S.)West Bank and GazaYemen, Rep.ZambiaZimbabwe Timeline:
This timeline shows a graph from 1963 to 2016 of Equatorial Guinea. No data until 1962. Number of actual observations by date: 52.
Source name:
World Development Indicators
Source organization:
World Bank national accounts data, and OECD National Accounts data files.
Categories, topics:
Economy & Growth
Last updated:
apr 23, 2017
Indicators value changes by year
Minimum:
8.666K
jan 1, 1963
Maximum:
14.773 mln
jan 1, 2013
At the date of observation
Value
Absolute change
Change from previous value
jan 1, 1963
8.666K
+8.666K
0.0%
jan 1, 1964
10.177K
+1.511K
17.44%
jan 1, 1965
11.766K
+1.589K
15.62%
jan 1, 1966
14.419K
+2.653K
22.55%
jan 1, 1967
15.053K
+633.7
4.39%
jan 1, 1968
15.789K
+736.45
4.89%
jan 1, 1969
16.37K
+580.609
3.68%
jan 1, 1970
16.115K
-254.897
-1.56%
jan 1, 1971
15.961K
-153.756
-0.95%
jan 1, 1972
15.836K
-125.624
-0.79%
jan 1, 1973
15.297K
-538.735
-3.4%
jan 1, 1974
18.029K
+2.733K
17.86%
jan 1, 1975
21.763K
+3.734K
20.71%
jan 1, 1976
25.131K
+3.368K
15.48%
jan 1, 1977
30.35K
+5.219K
20.77%
jan 1, 1978
35.848K
+5.498K
18.11%
jan 1, 1981
25.397K
-10.451K
-29.15%
jan 1, 1982
29.114K
+3.718K
14.64%
jan 1, 1983
38.728K
+9.614K
33.02%
jan 1, 1984
46.665K
+7.937K
20.49%
jan 1, 1985
54.828K
+8.163K
17.49%
jan 1, 1986
88.763K
+33.935K
61.89%
jan 1, 1987
80.123K
-8.64K
-9.73%
jan 1, 1988
81.721K
+1.598K
1.99%
jan 1, 1989
84.471K
+2.751K
3.37%
jan 1, 1990
77.049K
-7.422K
-8.79%
jan 1, 1991
80.893K
+3.845K
4.99%
jan 1, 1992
80.146K
-747.682
-0.92%
jan 1, 1993
88.239K
+8.094K
10.1%
jan 1, 1994
92.072K
+3.832K
4.34%
jan 1, 1995
129.199K
+37.127K
40.32%
jan 1, 1996
157.932K
+28.733K
22.24%
jan 1, 1997
256.373K
+98.441K
62.33%
jan 1, 1998
538.057K
+281.684K
109.87%
jan 1, 1999
440.61K
-97.447K
-18.11%
jan 1, 2000
744.958K
+304.348K
69.07%
jan 1, 2001
1.403 mln
+657.815K
88.3%
jan 1, 2002
1.951 mln
+548.152K
39.08%
jan 1, 2003
2.218 mln
+267.427K
13.71%
jan 1, 2004
2.461 mln
+242.8K
10.95%
jan 1, 2005
3.844 mln
+1.383 mln
56.18%
jan 1, 2006
6.925 mln
+3.082 mln
80.17%
jan 1, 2007
8.168 mln
+1.242 mln
17.94%
jan 1, 2008
9.41 mln
+1.242 mln
15.2%
jan 1, 2009
12.888 mln
+3.479 mln
36.97%
jan 1, 2010
10.034 mln
-2.854 mln
-22.14%
jan 1, 2011
11.078 mln
+1.043 mln
10.39%
jan 1, 2012
13.403 mln
+2.326 mln
20.99%
jan 1, 2013
14.773 mln
+1.37 mln
10.22%
jan 1, 2014
13.6 mln
-1.173 mln
-7.94%
jan 1, 2015
12.926 mln
-673.807K
-4.95%
jan 1, 2016
8.54 mln
-4.386 mln
-33.93%
Ranking of countries by current statistics by years


Comments: