29
/
en
AIzaSyAYiBZKx7MnpbEhh9jyipgxe19OcubqV5w
April 1, 2024
241596
Slovak Republic
SVK
true
2
1
GDP per capita (current LCU)
2016,2015,2014,2013,2012,2011,2010,2009,2008,2007,2006,2005,2004,2003,2002,2001,2000,1999,1998,1997,1996,1995,1994,1993,1992,1991
This statistics in other country:
AfghanistanAlbaniaAlgeriaAndorraAngolaAntigua and BarbudaArgentinaArmeniaArubaAustraliaAustriaAzerbaijanBahamas, TheBahrainBangladeshBarbadosBelarusBelgiumBelizeBeninBermudaBhutanBoliviaBosnia and HerzegovinaBotswanaBrazilBrunei DarussalamBulgariaBurkina FasoBurundiCabo VerdeCambodiaCameroonCanadaCayman IslandsCentral African RepublicChadChannel IslandsChileChinaColombiaComorosCongo, Dem. Rep.Congo, Rep.Costa RicaCote d'IvoireCroatiaCubaCyprusCzech RepublicDenmarkDjiboutiDominicaDominican RepublicEcuadorEgypt, Arab Rep.El SalvadorEquatorial GuineaEritreaEstoniaEthiopiaFaroe IslandsFijiFinlandFranceFrench PolynesiaGabonGambia, TheGeorgiaGermanyGhanaGreeceGreenlandGrenadaGuatemalaGuineaGuinea-BissauGuyanaHaitiHondurasHong Kong SAR, ChinaHungaryIcelandIndiaIndonesiaIran, Islamic Rep.IraqIrelandIsle of ManIsraelItalyJamaicaJapanJordanKazakhstanKenyaKiribatiKorea, Rep.KosovoKuwaitKyrgyz RepublicLao PDRLatviaLebanonLesothoLiberiaLibyaLiechtensteinLithuaniaLuxembourgMacao SAR, ChinaMacedonia, FYRMadagascarMalawiMalaysiaMaldivesMaliMaltaMarshall IslandsMauritaniaMauritiusMexicoMicronesia, Fed. Sts.MoldovaMonacoMongoliaMontenegroMoroccoMozambiqueMyanmarNamibiaNauruNepalNetherlandsNew CaledoniaNew ZealandNicaraguaNigerNigeriaNorwayOmanPakistanPalauPanamaPapua New GuineaParaguayPeruPhilippinesPolandPortugalPuerto RicoQatarRomaniaRussian FederationRwandaSamoaSan MarinoSao Tome and PrincipeSaudi ArabiaSenegalSerbiaSeychellesSierra LeoneSingaporeSint Maarten (Dutch part)Slovak RepublicSloveniaSolomon IslandsSomaliaSouth AfricaSouth SudanSpainSri LankaSt. Kitts and NevisSt. LuciaSt. Vincent and the GrenadinesSudanSurinameSwazilandSwedenSwitzerlandSyrian Arab RepublicTajikistanTanzaniaThailandTimor-LesteTogoTongaTrinidad and TobagoTunisiaTurkeyTurkmenistanTuvaluUgandaUkraineUnited Arab EmiratesUnited KingdomUnited StatesUruguayUzbekistanVanuatuVenezuela, RBVietnamVirgin Islands (U.S.)West Bank and GazaYemen, Rep.ZambiaZimbabwe Timeline:
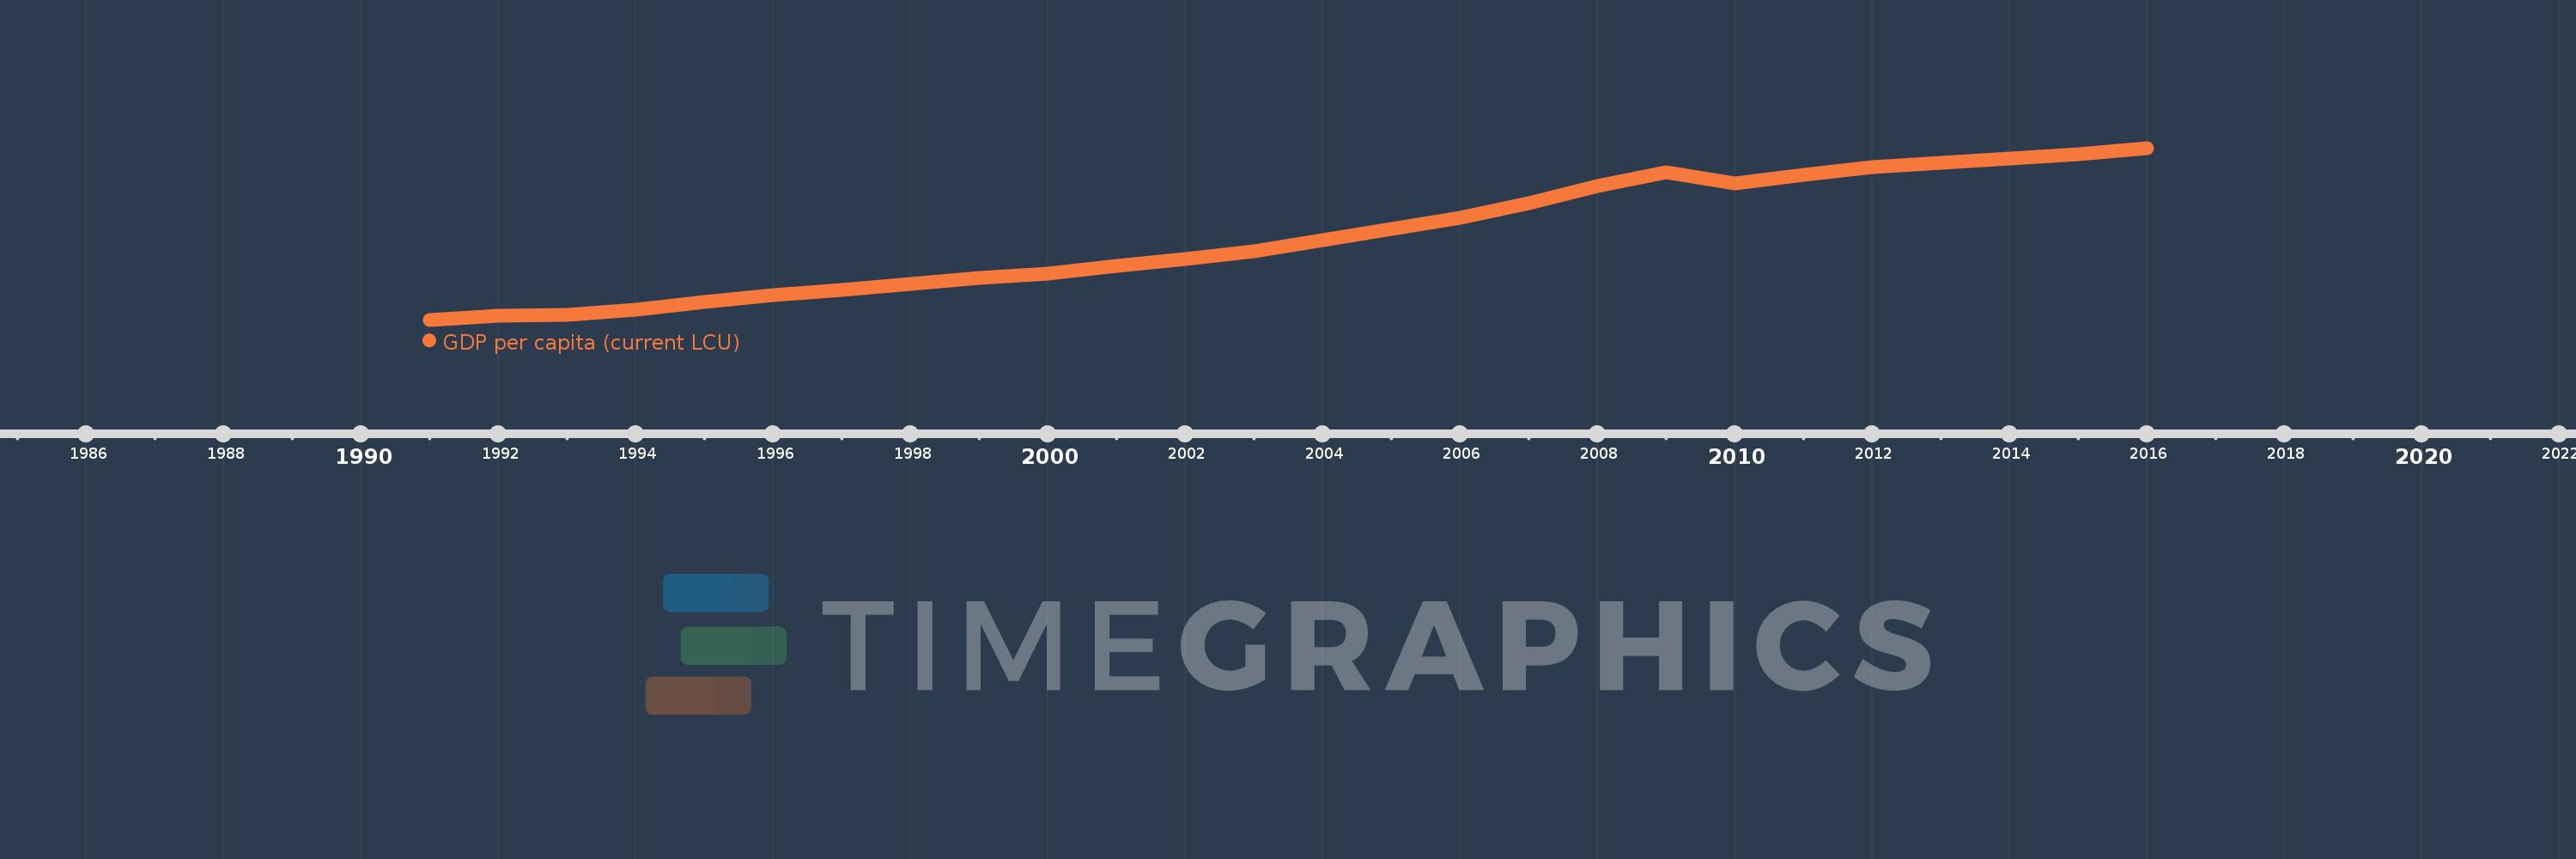
This timeline shows a graph from 1991 to 2016 of Slovak Republic. No data until 1990. Number of actual observations by date: 26.
Source name:
World Development Indicators
Source organization:
World Bank national accounts data, and OECD National Accounts data files.
Categories, topics:
Economy & Growth
Last updated:
apr 23, 2017
Indicators value changes by year
Minimum:
1.887K
jan 1, 1991
Maximum:
14.507K
jan 1, 2016
At the date of observation
Value
Absolute change
Change from previous value
jan 1, 1991
1.887K
+1.887K
0.0%
jan 1, 1992
2.168K
+281.139
14.9%
jan 1, 1993
2.248K
+80.335
3.71%
jan 1, 1994
2.638K
+389.543
17.33%
jan 1, 1995
3.166K
+527.941
20.01%
jan 1, 1996
3.671K
+505.648
15.97%
jan 1, 1997
4.085K
+413.893
11.27%
jan 1, 1998
4.535K
+450.2
11.02%
jan 1, 1999
4.946K
+411.031
9.06%
jan 1, 2000
5.29K
+344.018
6.95%
jan 1, 2001
5.864K
+573.846
10.85%
jan 1, 2002
6.379K
+514.442
8.77%
jan 1, 2003
6.933K
+554.536
8.69%
jan 1, 2004
7.705K
+772.147
11.14%
jan 1, 2005
8.581K
+875.906
11.37%
jan 1, 2006
9.383K
+802.01
9.35%
jan 1, 2007
10.473K
+1.09K
11.61%
jan 1, 2008
11.732K
+1.259K
12.02%
jan 1, 2009
12.733K
+1.001K
8.53%
jan 1, 2010
11.886K
-846.556
-6.65%
jan 1, 2011
12.534K
+648.165
5.45%
jan 1, 2012
13.083K
+548.818
4.38%
jan 1, 2013
13.445K
+361.716
2.76%
jan 1, 2014
13.701K
+256.437
1.91%
jan 1, 2015
14.016K
+314.557
2.3%
jan 1, 2016
14.507K
+491.063
3.5%
Ranking of countries by current statistics by years


Comments: