29
/
en
AIzaSyAYiBZKx7MnpbEhh9jyipgxe19OcubqV5w
April 1, 2024
195549
Mexico
MEX
true
2
1
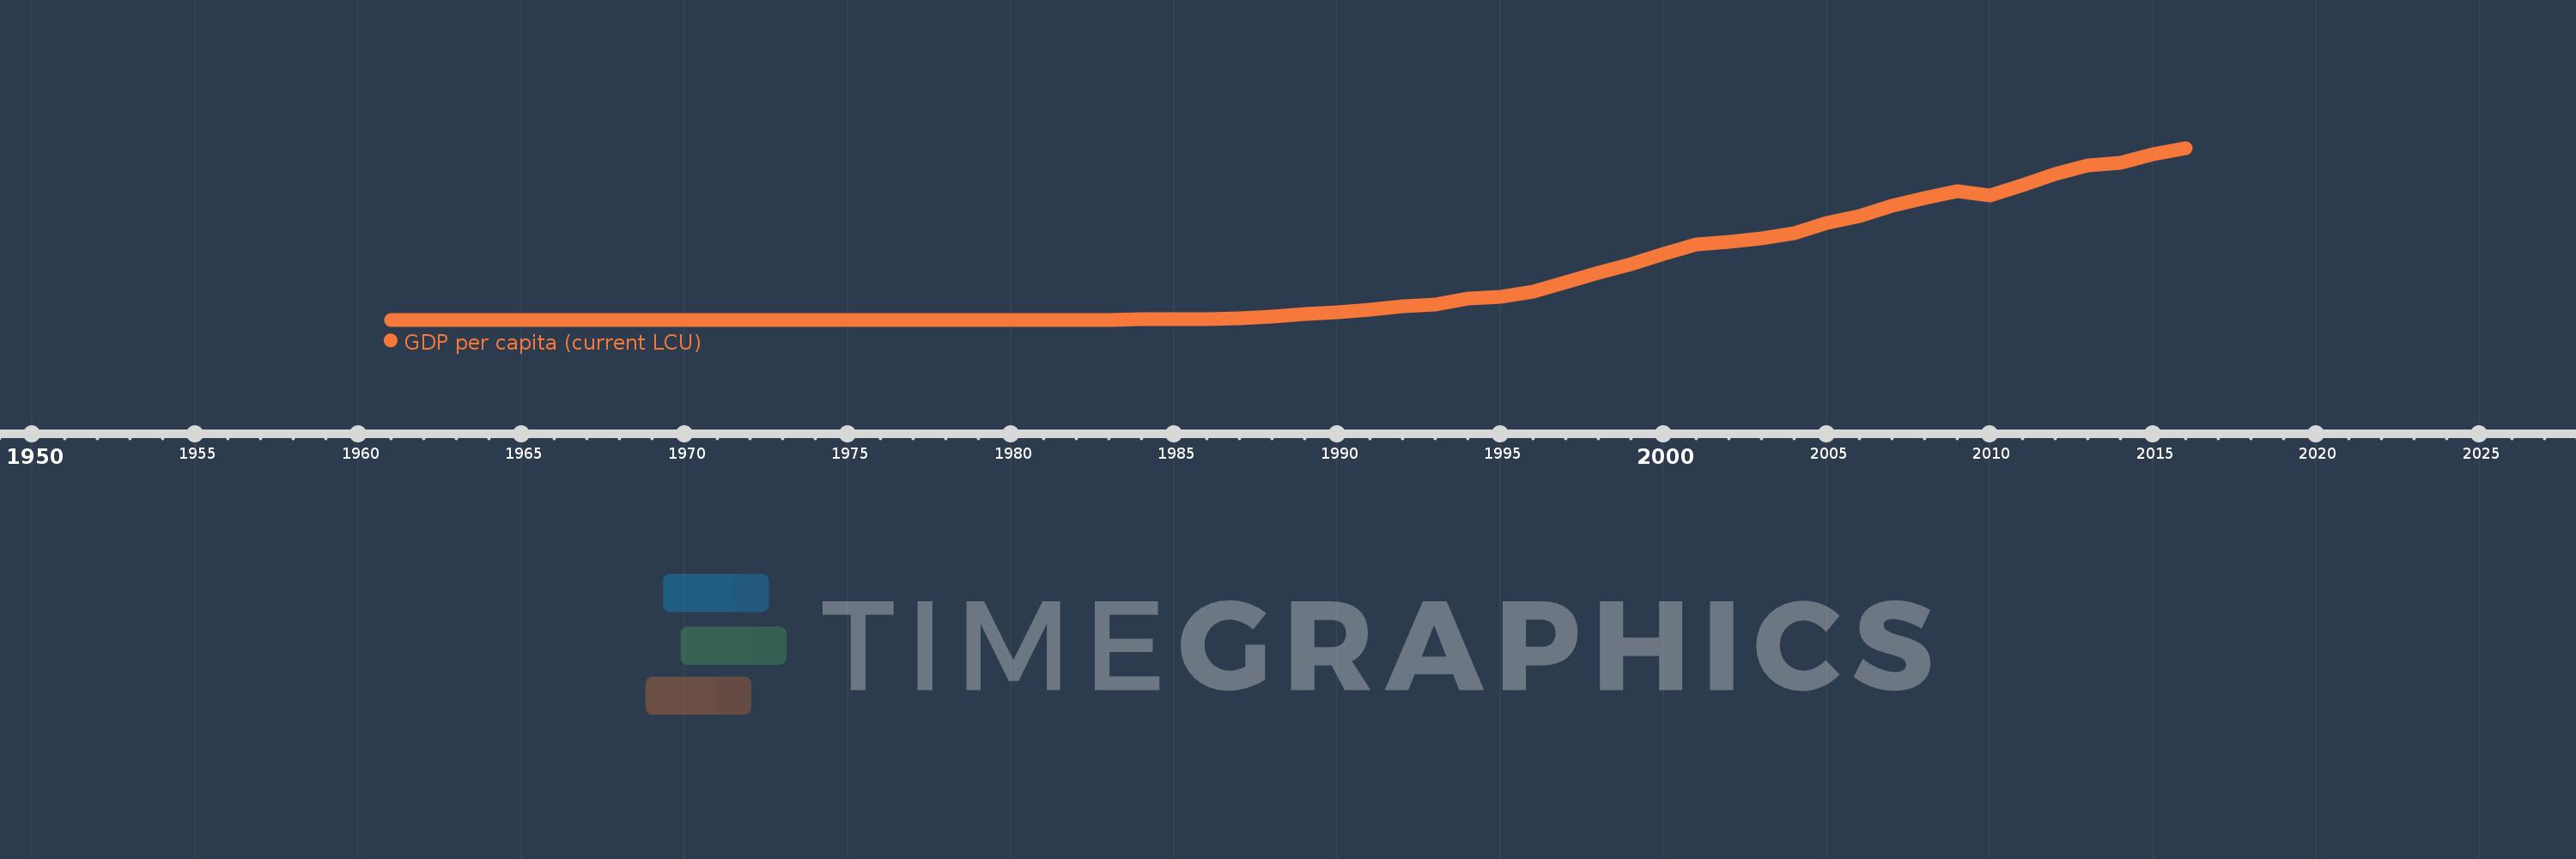
GDP per capita (current LCU)
2016,2015,2014,2013,2012,2011,2010,2009,2008,2007,2006,2005,2004,2003,2002,2001,2000,1999,1998,1997,1996,1995,1994,1993,1992,1991,1990,1989,1988,1987,1986,1985,1984,1983,1982,1981,1980,1979,1978,1977,1976,1975,1974,1973,1972,1971,1970,1969,1968,1967,1966,1965,1964,1963,1962,1961
This statistics in other country:
AfghanistanAlbaniaAlgeriaAndorraAngolaAntigua and BarbudaArgentinaArmeniaArubaAustraliaAustriaAzerbaijanBahamas, TheBahrainBangladeshBarbadosBelarusBelgiumBelizeBeninBermudaBhutanBoliviaBosnia and HerzegovinaBotswanaBrazilBrunei DarussalamBulgariaBurkina FasoBurundiCabo VerdeCambodiaCameroonCanadaCayman IslandsCentral African RepublicChadChannel IslandsChileChinaColombiaComorosCongo, Dem. Rep.Congo, Rep.Costa RicaCote d'IvoireCroatiaCubaCyprusCzech RepublicDenmarkDjiboutiDominicaDominican RepublicEcuadorEgypt, Arab Rep.El SalvadorEquatorial GuineaEritreaEstoniaEthiopiaFaroe IslandsFijiFinlandFranceFrench PolynesiaGabonGambia, TheGeorgiaGermanyGhanaGreeceGreenlandGrenadaGuatemalaGuineaGuinea-BissauGuyanaHaitiHondurasHong Kong SAR, ChinaHungaryIcelandIndiaIndonesiaIran, Islamic Rep.IraqIrelandIsle of ManIsraelItalyJamaicaJapanJordanKazakhstanKenyaKiribatiKorea, Rep.KosovoKuwaitKyrgyz RepublicLao PDRLatviaLebanonLesothoLiberiaLibyaLiechtensteinLithuaniaLuxembourgMacao SAR, ChinaMacedonia, FYRMadagascarMalawiMalaysiaMaldivesMaliMaltaMarshall IslandsMauritaniaMauritiusMexicoMicronesia, Fed. Sts.MoldovaMonacoMongoliaMontenegroMoroccoMozambiqueMyanmarNamibiaNauruNepalNetherlandsNew CaledoniaNew ZealandNicaraguaNigerNigeriaNorwayOmanPakistanPalauPanamaPapua New GuineaParaguayPeruPhilippinesPolandPortugalPuerto RicoQatarRomaniaRussian FederationRwandaSamoaSan MarinoSao Tome and PrincipeSaudi ArabiaSenegalSerbiaSeychellesSierra LeoneSingaporeSint Maarten (Dutch part)Slovak RepublicSloveniaSolomon IslandsSomaliaSouth AfricaSouth SudanSpainSri LankaSt. Kitts and NevisSt. LuciaSt. Vincent and the GrenadinesSudanSurinameSwazilandSwedenSwitzerlandSyrian Arab RepublicTajikistanTanzaniaThailandTimor-LesteTogoTongaTrinidad and TobagoTunisiaTurkeyTurkmenistanTuvaluUgandaUkraineUnited Arab EmiratesUnited KingdomUnited StatesUruguayUzbekistanVanuatuVenezuela, RBVietnamVirgin Islands (U.S.)West Bank and GazaYemen, Rep.ZambiaZimbabwe Timeline:
This timeline shows a graph from 1961 to 2016 of Mexico. No data until 1960. Number of actual observations by date: 56.
Source name:
World Development Indicators
Source organization:
World Bank national accounts data, and OECD National Accounts data files.
Categories, topics:
Economy & Growth
Last updated:
apr 23, 2017
Indicators value changes by year
Maximum:
142.714K
jan 1, 2016
At the date of observation
Value
Absolute change
Change from previous value
jan 1, 1961
4.275
+4.275
0.0%
jan 1, 1962
4.491
+0.216
5.05%
jan 1, 1963
4.681
+0.189
4.22%
jan 1, 1964
5.048
+0.367
7.85%
jan 1, 1965
5.799
+0.751
14.88%
jan 1, 1966
6.115
+0.316
5.46%
jan 1, 1967
6.612
+0.497
8.12%
jan 1, 1968
6.999
+0.387
5.85%
jan 1, 1969
7.507
+0.508
7.26%
jan 1, 1970
8.061
+0.554
7.38%
jan 1, 1971
8.539
+0.478
5.93%
jan 1, 1972
9.122
+0.583
6.83%
jan 1, 1973
10.179
+1.057
11.59%
jan 1, 1974
12.061
+1.882
18.49%
jan 1, 1975
15.226
+3.165
26.24%
jan 1, 1976
18.071
+2.845
18.69%
jan 1, 1977
21.893
+3.822
21.15%
jan 1, 1978
28.743
+6.85
31.29%
jan 1, 1979
35.401
+6.658
23.16%
jan 1, 1980
45.318
+9.917
28.01%
jan 1, 1981
64.476
+19.158
42.27%
jan 1, 1982
86.356
+21.88
33.93%
jan 1, 1983
135.053
+48.697
56.39%
jan 1, 1984
241.172
+106.119
78.58%
jan 1, 1985
389.205
+148.033
61.38%
jan 1, 1986
612.901
+223.696
57.48%
jan 1, 1987
1.003K
+390.292
63.68%
jan 1, 1988
2.399K
+1.396K
139.16%
jan 1, 1989
5.063K
+2.664K
111.03%
jan 1, 1990
6.542K
+1.479K
29.2%
jan 1, 1991
8.631K
+2.089K
31.94%
jan 1, 1992
10.866K
+2.235K
25.9%
jan 1, 1993
12.629K
+1.762K
16.22%
jan 1, 1994
17.276K
+4.647K
36.8%
jan 1, 1995
19.207K
+1.931K
11.18%
jan 1, 1996
23.372K
+4.165K
21.69%
jan 1, 1997
31.399K
+8.027K
34.35%
jan 1, 1998
38.859K
+7.459K
23.76%
jan 1, 1999
46.033K
+7.174K
18.46%
jan 1, 2000
54.706K
+8.673K
18.84%
jan 1, 2001
62.877K
+8.171K
14.94%
jan 1, 2002
64.95K
+2.073K
3.3%
jan 1, 2003
67.822K
+2.871K
4.42%
jan 1, 2004
71.997K
+4.175K
6.16%
jan 1, 2005
80.301K
+8.304K
11.53%
jan 1, 2006
86.028K
+5.726K
7.13%
jan 1, 2007
94.456K
+8.429K
9.8%
jan 1, 2008
100.79K
+6.333K
6.71%
jan 1, 2009
106.607K
+5.817K
5.77%
jan 1, 2010
103.53K
-3.077K
-2.89%
jan 1, 2011
111.974K
+8.444K
8.16%
jan 1, 2012
120.882K
+8.908K
7.96%
jan 1, 2013
128.015K
+7.133K
5.9%
jan 1, 2014
130.257K
+2.242K
1.75%
jan 1, 2015
137.623K
+7.366K
5.66%
jan 1, 2016
142.714K
+5.091K
3.7%
Ranking of countries by current statistics by years


Comments: