29
/
en
AIzaSyAYiBZKx7MnpbEhh9jyipgxe19OcubqV5w
April 1, 2024
275480
United Kingdom
GBR
true
2
1
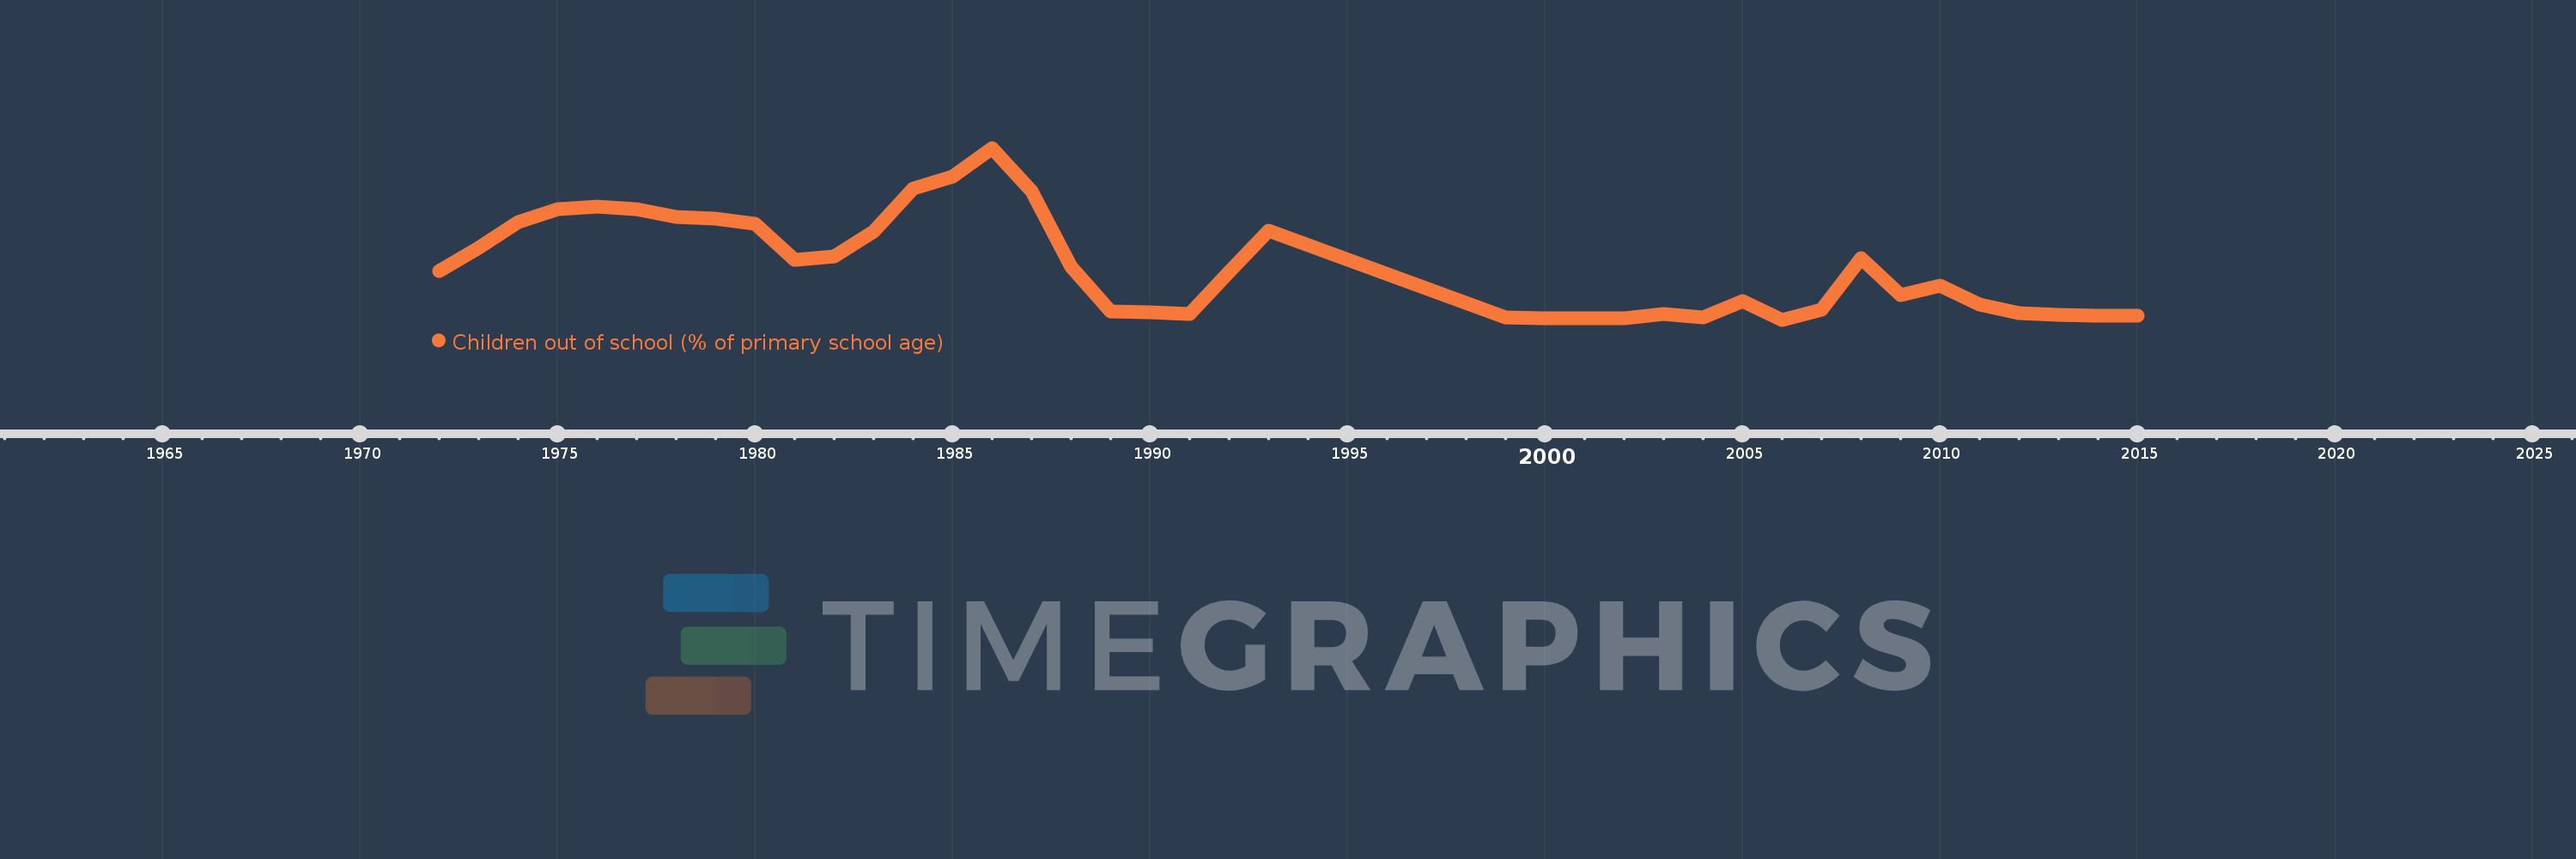
Children out of school (% of primary school age)
2015,2014,2013,2012,2011,2010,2009,2008,2007,2006,2005,2004,2003,2002,2001,2000,1999,1993,1992,1991,1990,1989,1988,1987,1986,1985,1984,1983,1982,1981,1980,1979,1978,1977,1976,1975,1974,1973,1972
This statistics in other country:
AfghanistanAlbaniaAlgeriaAngolaAntigua and BarbudaArab WorldArgentinaArmeniaArubaAustraliaAustriaAzerbaijanBahamas, TheBahrainBangladeshBarbadosBelarusBelgiumBelizeBeninBermudaBhutanBoliviaBosnia and HerzegovinaBotswanaBrazilBrunei DarussalamBulgariaBurkina FasoBurundiCabo VerdeCambodiaCameroonCanadaCaribbean small statesCentral African RepublicCentral Europe and the BalticsChadChileChinaColombiaComorosCongo, Dem. Rep.Congo, Rep.Costa RicaCote d'IvoireCroatiaCubaCyprusDenmarkDjiboutiDominicaDominican RepublicEarly-demographic dividendEast Asia & PacificEast Asia & Pacific (excluding high income)East Asia & Pacific (IDA & IBRD countries)EcuadorEgypt, Arab Rep.El SalvadorEquatorial GuineaEritreaEstoniaEthiopiaEuro areaEurope & Central AsiaEurope & Central Asia (excluding high income)Europe & Central Asia (IDA & IBRD countries)European UnionFijiFinlandFragile and conflict affected situationsFranceGabonGambia, TheGeorgiaGermanyGhanaGreeceGrenadaGuatemalaGuineaGuinea-BissauGuyanaHaitiHeavily indebted poor countries (HIPC)High incomeHondurasHong Kong SAR, ChinaHungaryIBRD onlyIcelandIDA & IBRD totalIDA blendIDA onlyIDA totalIndiaIndonesiaIran, Islamic Rep.IraqIrelandIsraelItalyJamaicaJapanJordanKazakhstanKenyaKiribatiKorea, Dem. People’s Rep.Korea, Rep.KuwaitKyrgyz RepublicLao PDRLate-demographic dividendLatin America & Caribbean Latin America & Caribbean (excluding high income)Latin America & the Caribbean (IDA & IBRD countries)LatviaLeast developed countries: UN classificationLebanonLesothoLiberiaLibyaLiechtensteinLithuaniaLow & middle incomeLow incomeLower middle incomeLuxembourgMacao SAR, ChinaMacedonia, FYRMadagascarMalawiMalaysiaMaldivesMaliMaltaMarshall IslandsMauritaniaMauritiusMexicoMicronesia, Fed. Sts.Middle East & North AfricaMiddle East & North Africa (excluding high income)Middle East & North Africa (IDA & IBRD countries)Middle incomeMoldovaMongoliaMontenegroMoroccoMozambiqueMyanmarNamibiaNauruNepalNetherlandsNew ZealandNicaraguaNigerNigeriaNorth AmericaNorwayOECD membersOmanOther small statesPacific island small statesPakistanPalauPanamaPapua New GuineaParaguayPeruPhilippinesPolandPortugalPost-demographic dividendPre-demographic dividendPuerto RicoQatarRomaniaRussian FederationRwandaSamoaSan MarinoSao Tome and PrincipeSaudi ArabiaSenegalSerbiaSeychellesSierra LeoneSloveniaSmall statesSolomon IslandsSomaliaSouth AfricaSouth AsiaSouth Asia (IDA & IBRD)South SudanSpainSri LankaSt. Kitts and NevisSt. LuciaSt. Vincent and the GrenadinesSub-Saharan Africa Sub-Saharan Africa (excluding high income)Sub-Saharan Africa (IDA & IBRD countries)SudanSurinameSwazilandSwedenSwitzerlandSyrian Arab RepublicTajikistanTanzaniaThailandTimor-LesteTogoTongaTrinidad and TobagoTunisiaTurkeyTuvaluUgandaUkraineUnited Arab EmiratesUnited KingdomUnited StatesUpper middle incomeUruguayUzbekistanVanuatuVenezuela, RBVietnamWest Bank and GazaWorldYemen, Rep.ZambiaZimbabwe Timeline:
This timeline shows a graph from 1972 to 2015 of United Kingdom. No data until 1971. Number of actual observations by date: 39.
Source name:
World Development Indicators
Source organization:
United Nations Educational, Scientific, and Cultural Organization (UNESCO) Institute for Statistics.
Categories, topics:
Education
Last updated:
apr 23, 2017
Indicators value changes by year
At the date of observation
Value
Absolute change
Change from previous value
jan 1, 1972
1.838
+1.838
0.0%
jan 1, 1973
2.699
+0.861
46.86%
jan 1, 1974
3.652
+0.953
35.31%
jan 1, 1975
4.146
+0.494
13.52%
jan 1, 1976
4.239
+0.092
2.23%
jan 1, 1977
4.158
-0.081
-1.9%
jan 1, 1978
3.849
-0.309
-7.43%
jan 1, 1979
3.778
-0.071
-1.86%
jan 1, 1980
3.607
-0.171
-4.52%
jan 1, 1981
2.245
-1.362
-37.76%
jan 1, 1982
2.368
+0.123
5.5%
jan 1, 1983
3.322
+0.954
40.27%
jan 1, 1984
4.904
+1.582
47.63%
jan 1, 1985
5.367
+0.462
9.42%
jan 1, 1986
6.434
+1.068
19.9%
jan 1, 1987
4.811
-1.623
-25.23%
jan 1, 1988
1.985
-2.826
-58.74%
jan 1, 1989
0.311
-1.675
-84.36%
jan 1, 1990
0.281
-0.03
-9.57%
jan 1, 1991
0.207
-0.074
-26.34%
jan 1, 1992
1.798
+1.591
769.1%
jan 1, 1993
3.33
+1.532
85.24%
jan 1, 1999
0.102
-3.228
-96.93%
jan 1, 2000
0.05
-0.052
-50.71%
jan 1, 2001
0.048
-0.003
-5.29%
jan 1, 2002
0.056
+0.008
17.1%
jan 1, 2003
0.209
+0.153
274.93%
jan 1, 2004
0.092
-0.117
-56.1%
jan 1, 2005
0.714
+0.622
677.0%
jan 1, 2006
0.006
-0.708
-99.21%
jan 1, 2007
0.38
+0.374
6.67K%
jan 1, 2008
2.297
+1.917
504.39%
jan 1, 2009
0.932
-1.365
-59.43%
jan 1, 2010
1.27
+0.338
36.28%
jan 1, 2011
0.577
-0.693
-54.57%
jan 1, 2012
0.262
-0.315
-54.62%
jan 1, 2013
0.199
-0.063
-24.06%
jan 1, 2014
0.173
-0.026
-13.24%
jan 1, 2015
0.146
-0.027
-15.57%
Ranking of countries by current statistics by years


Comments: