29
/
en
AIzaSyAYiBZKx7MnpbEhh9jyipgxe19OcubqV5w
April 1, 2024
274583
United Arab Emirates
ARE
true
2
1
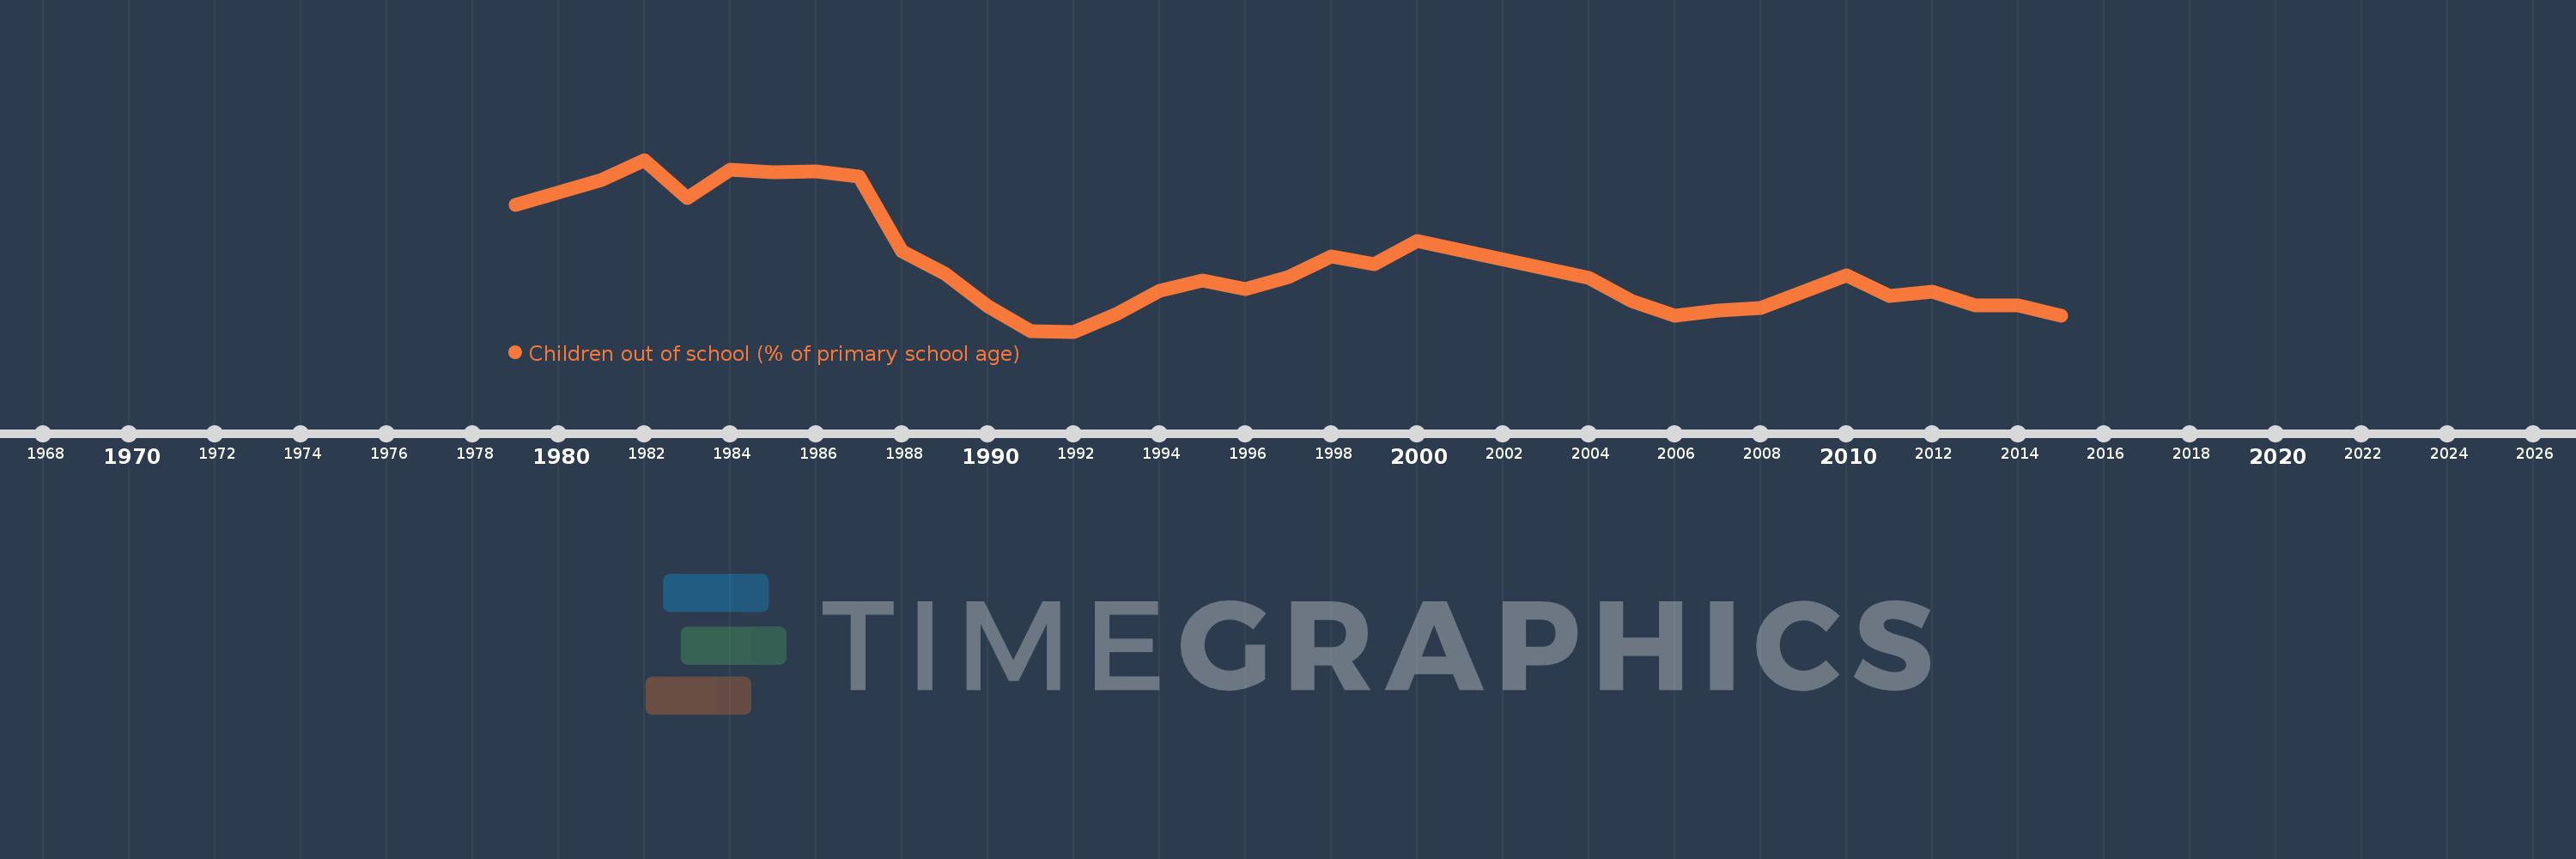
Children out of school (% of primary school age)
2015,2014,2013,2012,2011,2010,2008,2007,2006,2005,2004,2000,1999,1998,1997,1996,1995,1994,1993,1992,1991,1990,1989,1988,1987,1986,1985,1984,1983,1982,1981,1979
This statistics in other country:
AfghanistanAlbaniaAlgeriaAngolaAntigua and BarbudaArab WorldArgentinaArmeniaArubaAustraliaAustriaAzerbaijanBahamas, TheBahrainBangladeshBarbadosBelarusBelgiumBelizeBeninBermudaBhutanBoliviaBosnia and HerzegovinaBotswanaBrazilBrunei DarussalamBulgariaBurkina FasoBurundiCabo VerdeCambodiaCameroonCanadaCaribbean small statesCentral African RepublicCentral Europe and the BalticsChadChileChinaColombiaComorosCongo, Dem. Rep.Congo, Rep.Costa RicaCote d'IvoireCroatiaCubaCyprusDenmarkDjiboutiDominicaDominican RepublicEarly-demographic dividendEast Asia & PacificEast Asia & Pacific (excluding high income)East Asia & Pacific (IDA & IBRD countries)EcuadorEgypt, Arab Rep.El SalvadorEquatorial GuineaEritreaEstoniaEthiopiaEuro areaEurope & Central AsiaEurope & Central Asia (excluding high income)Europe & Central Asia (IDA & IBRD countries)European UnionFijiFinlandFragile and conflict affected situationsFranceGabonGambia, TheGeorgiaGermanyGhanaGreeceGrenadaGuatemalaGuineaGuinea-BissauGuyanaHaitiHeavily indebted poor countries (HIPC)High incomeHondurasHong Kong SAR, ChinaHungaryIBRD onlyIcelandIDA & IBRD totalIDA blendIDA onlyIDA totalIndiaIndonesiaIran, Islamic Rep.IraqIrelandIsraelItalyJamaicaJapanJordanKazakhstanKenyaKiribatiKorea, Dem. People’s Rep.Korea, Rep.KuwaitKyrgyz RepublicLao PDRLate-demographic dividendLatin America & Caribbean Latin America & Caribbean (excluding high income)Latin America & the Caribbean (IDA & IBRD countries)LatviaLeast developed countries: UN classificationLebanonLesothoLiberiaLibyaLiechtensteinLithuaniaLow & middle incomeLow incomeLower middle incomeLuxembourgMacao SAR, ChinaMacedonia, FYRMadagascarMalawiMalaysiaMaldivesMaliMaltaMarshall IslandsMauritaniaMauritiusMexicoMicronesia, Fed. Sts.Middle East & North AfricaMiddle East & North Africa (excluding high income)Middle East & North Africa (IDA & IBRD countries)Middle incomeMoldovaMongoliaMontenegroMoroccoMozambiqueMyanmarNamibiaNauruNepalNetherlandsNew ZealandNicaraguaNigerNigeriaNorth AmericaNorwayOECD membersOmanOther small statesPacific island small statesPakistanPalauPanamaPapua New GuineaParaguayPeruPhilippinesPolandPortugalPost-demographic dividendPre-demographic dividendPuerto RicoQatarRomaniaRussian FederationRwandaSamoaSan MarinoSao Tome and PrincipeSaudi ArabiaSenegalSerbiaSeychellesSierra LeoneSloveniaSmall statesSolomon IslandsSomaliaSouth AfricaSouth AsiaSouth Asia (IDA & IBRD)South SudanSpainSri LankaSt. Kitts and NevisSt. LuciaSt. Vincent and the GrenadinesSub-Saharan Africa Sub-Saharan Africa (excluding high income)Sub-Saharan Africa (IDA & IBRD countries)SudanSurinameSwazilandSwedenSwitzerlandSyrian Arab RepublicTajikistanTanzaniaThailandTimor-LesteTogoTongaTrinidad and TobagoTunisiaTurkeyTuvaluUgandaUkraineUnited Arab EmiratesUnited KingdomUnited StatesUpper middle incomeUruguayUzbekistanVanuatuVenezuela, RBVietnamWest Bank and GazaWorldYemen, Rep.ZambiaZimbabwe Timeline:
This timeline shows a graph from 1979 to 2015 of United Arab Emirates. No data until 1978. Number of actual observations by date: 32.
Source name:
World Development Indicators
Source organization:
United Nations Educational, Scientific, and Cultural Organization (UNESCO) Institute for Statistics.
Categories, topics:
Education
Last updated:
apr 23, 2017
Indicators value changes by year
Maximum:
26.727
jan 1, 1982
At the date of observation
Value
Absolute change
Change from previous value
jan 1, 1979
20.136
+20.136
0.0%
jan 1, 1981
23.802
+3.666
18.21%
jan 1, 1982
26.727
+2.925
12.29%
jan 1, 1983
21.162
-5.566
-20.82%
jan 1, 1984
25.217
+4.055
19.16%
jan 1, 1985
24.926
-0.291
-1.15%
jan 1, 1986
25.044
+0.117
0.47%
jan 1, 1987
24.291
-0.753
-3.01%
jan 1, 1988
13.265
-11.025
-45.39%
jan 1, 1989
9.995
-3.27
-24.65%
jan 1, 1990
5.255
-4.74
-47.42%
jan 1, 1991
1.592
-3.663
-69.7%
jan 1, 1992
1.471
-0.121
-7.63%
jan 1, 1993
4.116
+2.645
179.84%
jan 1, 1994
7.498
+3.383
82.18%
jan 1, 1995
9.029
+1.53
20.41%
jan 1, 1996
7.682
-1.346
-14.91%
jan 1, 1997
9.485
+1.803
23.47%
jan 1, 1998
12.484
+2.999
31.62%
jan 1, 1999
11.437
-1.046
-8.38%
jan 1, 2000
14.787
+3.349
29.28%
jan 1, 2004
9.308
-5.479
-37.05%
jan 1, 2005
5.902
-3.406
-36.59%
jan 1, 2006
3.766
-2.135
-36.18%
jan 1, 2007
4.617
+0.851
22.6%
jan 1, 2008
4.918
+0.301
6.52%
jan 1, 2010
9.792
+4.873
99.09%
jan 1, 2011
6.766
-3.026
-30.9%
jan 1, 2012
7.327
+0.561
8.29%
jan 1, 2013
5.382
-1.945
-26.54%
jan 1, 2014
5.31
-0.072
-1.34%
jan 1, 2015
3.805
-1.505
-28.35%
Ranking of countries by current statistics by years


Comments: