29
/
en
AIzaSyAYiBZKx7MnpbEhh9jyipgxe19OcubqV5w
April 1, 2024
49841
Middle East & North Africa (IDA & IBRD countries)
TMN
false
2
1
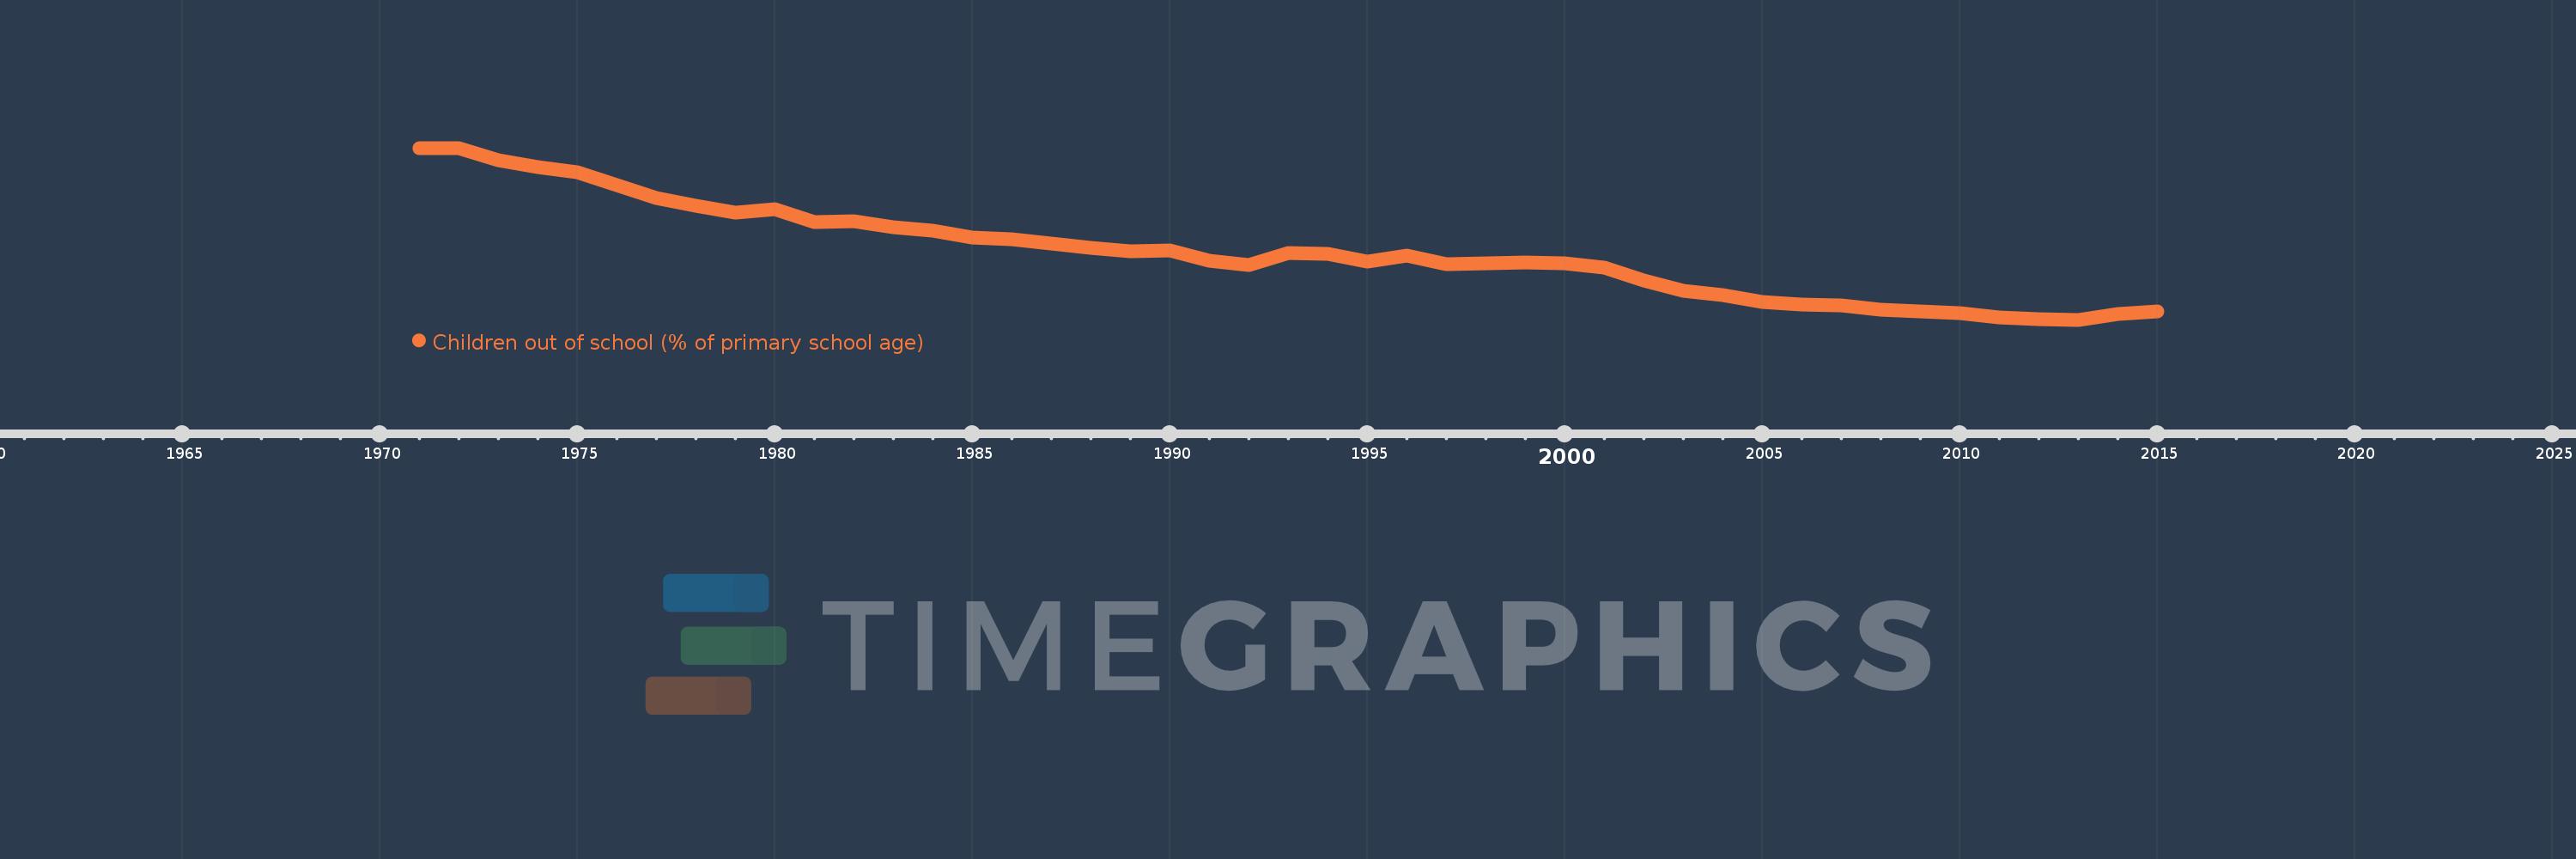
Children out of school (% of primary school age)
2015,2014,2013,2012,2011,2010,2009,2008,2007,2006,2005,2004,2003,2002,2001,2000,1999,1998,1997,1996,1995,1994,1993,1992,1991,1990,1989,1988,1987,1986,1985,1984,1983,1982,1981,1980,1979,1978,1977,1976,1975,1974,1973,1972,1971
This statistics in other country:
AfghanistanAlbaniaAlgeriaAngolaAntigua and BarbudaArab WorldArgentinaArmeniaArubaAustraliaAustriaAzerbaijanBahamas, TheBahrainBangladeshBarbadosBelarusBelgiumBelizeBeninBermudaBhutanBoliviaBosnia and HerzegovinaBotswanaBrazilBrunei DarussalamBulgariaBurkina FasoBurundiCabo VerdeCambodiaCameroonCanadaCaribbean small statesCentral African RepublicCentral Europe and the BalticsChadChileChinaColombiaComorosCongo, Dem. Rep.Congo, Rep.Costa RicaCote d'IvoireCroatiaCubaCyprusDenmarkDjiboutiDominicaDominican RepublicEarly-demographic dividendEast Asia & PacificEast Asia & Pacific (excluding high income)East Asia & Pacific (IDA & IBRD countries)EcuadorEgypt, Arab Rep.El SalvadorEquatorial GuineaEritreaEstoniaEthiopiaEuro areaEurope & Central AsiaEurope & Central Asia (excluding high income)Europe & Central Asia (IDA & IBRD countries)European UnionFijiFinlandFragile and conflict affected situationsFranceGabonGambia, TheGeorgiaGermanyGhanaGreeceGrenadaGuatemalaGuineaGuinea-BissauGuyanaHaitiHeavily indebted poor countries (HIPC)High incomeHondurasHong Kong SAR, ChinaHungaryIBRD onlyIcelandIDA & IBRD totalIDA blendIDA onlyIDA totalIndiaIndonesiaIran, Islamic Rep.IraqIrelandIsraelItalyJamaicaJapanJordanKazakhstanKenyaKiribatiKorea, Dem. People’s Rep.Korea, Rep.KuwaitKyrgyz RepublicLao PDRLate-demographic dividendLatin America & Caribbean Latin America & Caribbean (excluding high income)Latin America & the Caribbean (IDA & IBRD countries)LatviaLeast developed countries: UN classificationLebanonLesothoLiberiaLibyaLiechtensteinLithuaniaLow & middle incomeLow incomeLower middle incomeLuxembourgMacao SAR, ChinaMacedonia, FYRMadagascarMalawiMalaysiaMaldivesMaliMaltaMarshall IslandsMauritaniaMauritiusMexicoMicronesia, Fed. Sts.Middle East & North AfricaMiddle East & North Africa (excluding high income)Middle East & North Africa (IDA & IBRD countries)Middle incomeMoldovaMongoliaMontenegroMoroccoMozambiqueMyanmarNamibiaNauruNepalNetherlandsNew ZealandNicaraguaNigerNigeriaNorth AmericaNorwayOECD membersOmanOther small statesPacific island small statesPakistanPalauPanamaPapua New GuineaParaguayPeruPhilippinesPolandPortugalPost-demographic dividendPre-demographic dividendPuerto RicoQatarRomaniaRussian FederationRwandaSamoaSan MarinoSao Tome and PrincipeSaudi ArabiaSenegalSerbiaSeychellesSierra LeoneSloveniaSmall statesSolomon IslandsSomaliaSouth AfricaSouth AsiaSouth Asia (IDA & IBRD)South SudanSpainSri LankaSt. Kitts and NevisSt. LuciaSt. Vincent and the GrenadinesSub-Saharan Africa Sub-Saharan Africa (excluding high income)Sub-Saharan Africa (IDA & IBRD countries)SudanSurinameSwazilandSwedenSwitzerlandSyrian Arab RepublicTajikistanTanzaniaThailandTimor-LesteTogoTongaTrinidad and TobagoTunisiaTurkeyTuvaluUgandaUkraineUnited Arab EmiratesUnited KingdomUnited StatesUpper middle incomeUruguayUzbekistanVanuatuVenezuela, RBVietnamWest Bank and GazaWorldYemen, Rep.ZambiaZimbabwe Timeline:
This timeline shows a graph from 1971 to 2015 of Middle East & North Africa (IDA & IBRD countries). No data until 1970. Number of actual observations by date: 45.
Source name:
World Development Indicators
Source organization:
United Nations Educational, Scientific, and Cultural Organization (UNESCO) Institute for Statistics.
Categories, topics:
Education
Last updated:
apr 23, 2017
Indicators value changes by year
Maximum:
39.319
jan 1, 1972
At the date of observation
Value
Absolute change
Change from previous value
jan 1, 1971
39.307
+39.307
0.0%
jan 1, 1972
39.319
+0.012
0.03%
jan 1, 1973
36.878
-2.441
-6.21%
jan 1, 1974
35.39
-1.488
-4.03%
jan 1, 1975
34.31
-1.08
-3.05%
jan 1, 1976
31.601
-2.709
-7.9%
jan 1, 1977
29.057
-2.544
-8.05%
jan 1, 1978
27.404
-1.652
-5.69%
jan 1, 1979
26.038
-1.366
-4.98%
jan 1, 1980
26.665
+0.627
2.41%
jan 1, 1981
24.059
-2.606
-9.77%
jan 1, 1982
24.351
+0.292
1.21%
jan 1, 1983
23.015
-1.336
-5.49%
jan 1, 1984
22.262
-0.752
-3.27%
jan 1, 1985
20.931
-1.331
-5.98%
jan 1, 1986
20.602
-0.33
-1.58%
jan 1, 1987
19.749
-0.853
-4.14%
jan 1, 1988
18.783
-0.966
-4.89%
jan 1, 1989
18.116
-0.667
-3.55%
jan 1, 1990
18.189
+0.073
0.4%
jan 1, 1991
16.137
-2.052
-11.28%
jan 1, 1992
15.198
-0.939
-5.82%
jan 1, 1993
17.711
+2.513
16.54%
jan 1, 1994
17.563
-0.148
-0.84%
jan 1, 1995
15.937
-1.627
-9.26%
jan 1, 1996
17.274
+1.338
8.39%
jan 1, 1997
15.473
-1.801
-10.43%
jan 1, 1998
15.553
+0.08
0.52%
jan 1, 1999
15.717
+0.164
1.05%
jan 1, 2000
15.694
-0.023
-0.15%
jan 1, 2001
14.794
-0.9
-5.74%
jan 1, 2002
12.135
-2.659
-17.97%
jan 1, 2003
9.936
-2.198
-18.12%
jan 1, 2004
9.043
-0.893
-8.99%
jan 1, 2005
7.684
-1.36
-15.04%
jan 1, 2006
7.217
-0.466
-6.07%
jan 1, 2007
6.951
-0.267
-3.7%
jan 1, 2008
6.075
-0.875
-12.59%
jan 1, 2009
5.743
-0.332
-5.46%
jan 1, 2010
5.363
-0.381
-6.63%
jan 1, 2011
4.481
-0.882
-16.44%
jan 1, 2012
4.164
-0.317
-7.07%
jan 1, 2013
4.038
-0.126
-3.02%
jan 1, 2014
5.24
+1.202
29.76%
jan 1, 2015
5.682
+0.442
8.43%
Ranking of countries by current statistics by years


Comments: