29
/
en
AIzaSyAYiBZKx7MnpbEhh9jyipgxe19OcubqV5w
April 1, 2024
54604
Post-demographic dividend
PST
false
2
1
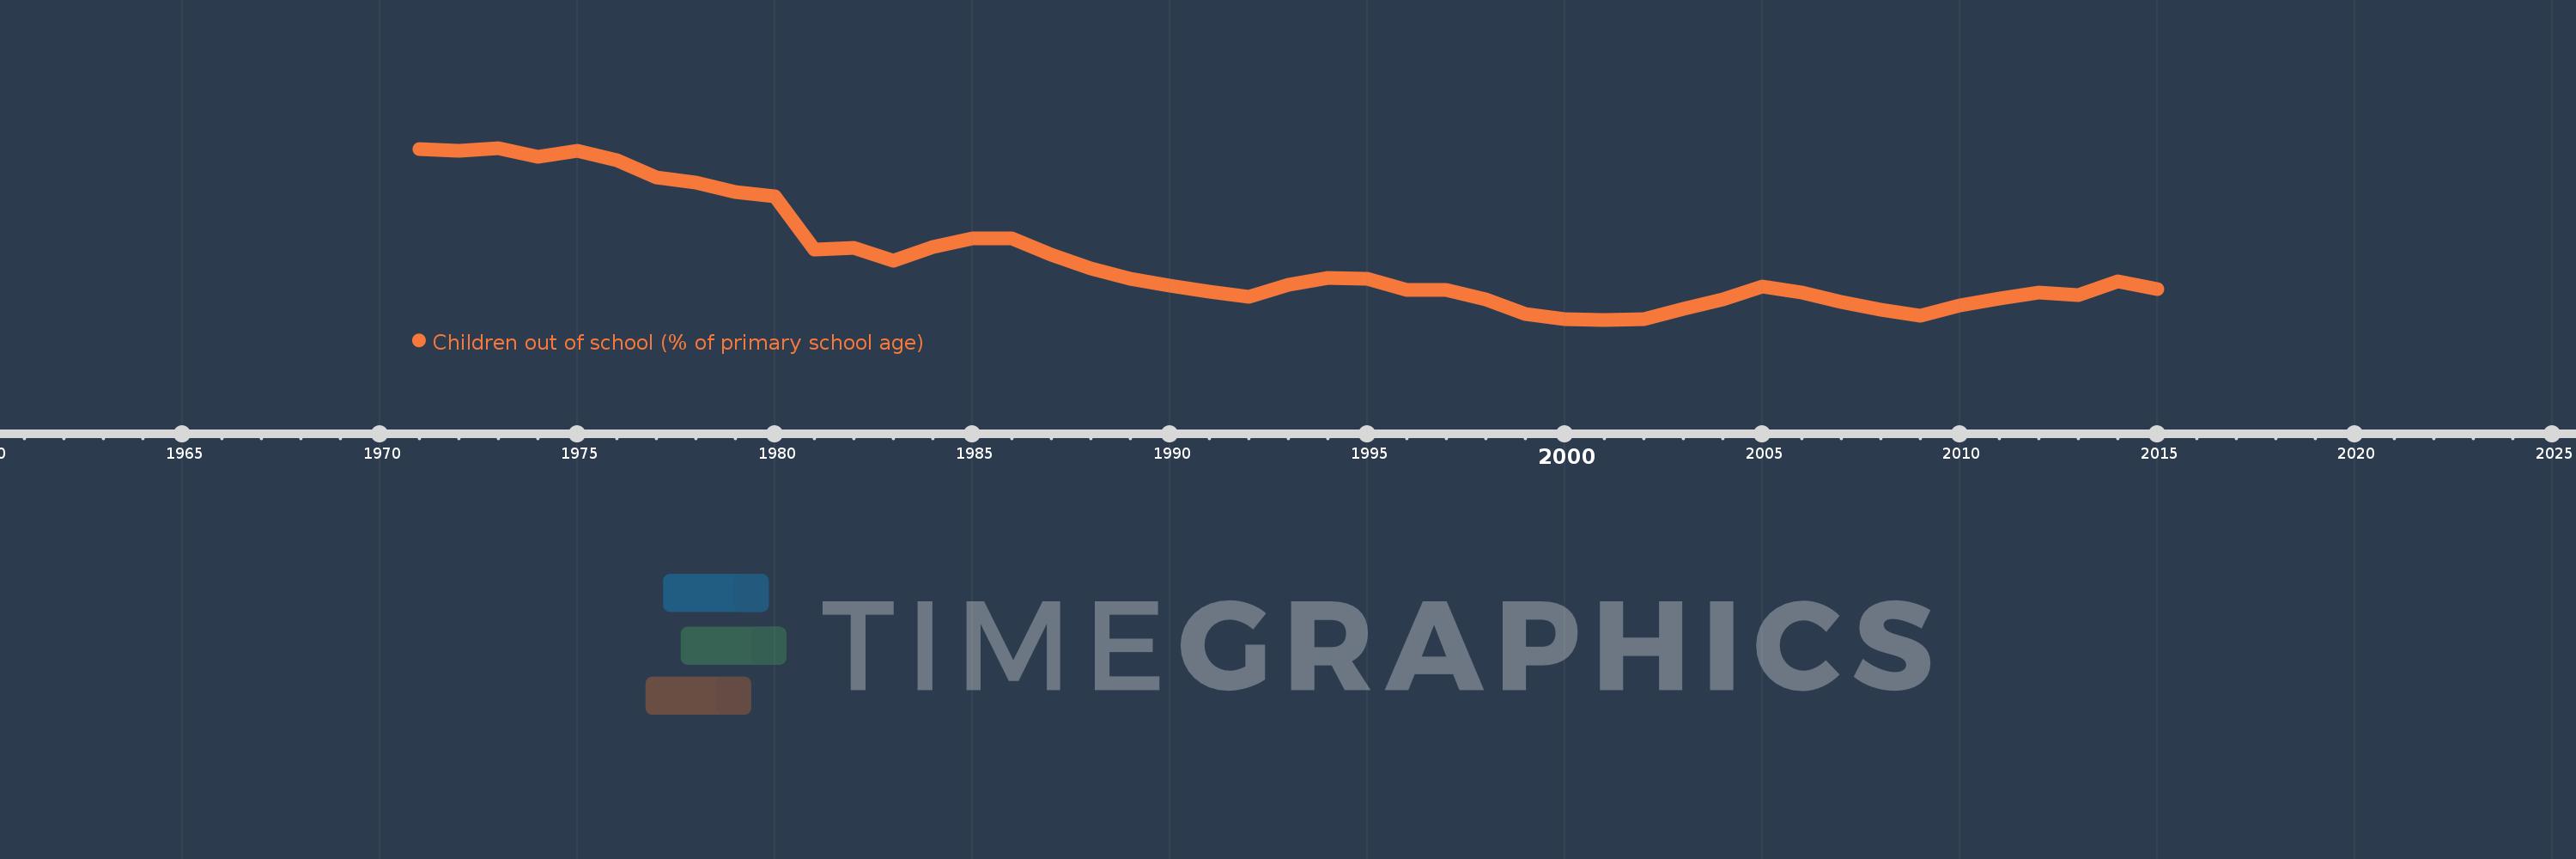
Children out of school (% of primary school age)
2015,2014,2013,2012,2011,2010,2009,2008,2007,2006,2005,2004,2003,2002,2001,2000,1999,1998,1997,1996,1995,1994,1993,1992,1991,1990,1989,1988,1987,1986,1985,1984,1983,1982,1981,1980,1979,1978,1977,1976,1975,1974,1973,1972,1971
This statistics in other country:
AfghanistanAlbaniaAlgeriaAngolaAntigua and BarbudaArab WorldArgentinaArmeniaArubaAustraliaAustriaAzerbaijanBahamas, TheBahrainBangladeshBarbadosBelarusBelgiumBelizeBeninBermudaBhutanBoliviaBosnia and HerzegovinaBotswanaBrazilBrunei DarussalamBulgariaBurkina FasoBurundiCabo VerdeCambodiaCameroonCanadaCaribbean small statesCentral African RepublicCentral Europe and the BalticsChadChileChinaColombiaComorosCongo, Dem. Rep.Congo, Rep.Costa RicaCote d'IvoireCroatiaCubaCyprusDenmarkDjiboutiDominicaDominican RepublicEarly-demographic dividendEast Asia & PacificEast Asia & Pacific (excluding high income)East Asia & Pacific (IDA & IBRD countries)EcuadorEgypt, Arab Rep.El SalvadorEquatorial GuineaEritreaEstoniaEthiopiaEuro areaEurope & Central AsiaEurope & Central Asia (excluding high income)Europe & Central Asia (IDA & IBRD countries)European UnionFijiFinlandFragile and conflict affected situationsFranceGabonGambia, TheGeorgiaGermanyGhanaGreeceGrenadaGuatemalaGuineaGuinea-BissauGuyanaHaitiHeavily indebted poor countries (HIPC)High incomeHondurasHong Kong SAR, ChinaHungaryIBRD onlyIcelandIDA & IBRD totalIDA blendIDA onlyIDA totalIndiaIndonesiaIran, Islamic Rep.IraqIrelandIsraelItalyJamaicaJapanJordanKazakhstanKenyaKiribatiKorea, Dem. People’s Rep.Korea, Rep.KuwaitKyrgyz RepublicLao PDRLate-demographic dividendLatin America & Caribbean Latin America & Caribbean (excluding high income)Latin America & the Caribbean (IDA & IBRD countries)LatviaLeast developed countries: UN classificationLebanonLesothoLiberiaLibyaLiechtensteinLithuaniaLow & middle incomeLow incomeLower middle incomeLuxembourgMacao SAR, ChinaMacedonia, FYRMadagascarMalawiMalaysiaMaldivesMaliMaltaMarshall IslandsMauritaniaMauritiusMexicoMicronesia, Fed. Sts.Middle East & North AfricaMiddle East & North Africa (excluding high income)Middle East & North Africa (IDA & IBRD countries)Middle incomeMoldovaMongoliaMontenegroMoroccoMozambiqueMyanmarNamibiaNauruNepalNetherlandsNew ZealandNicaraguaNigerNigeriaNorth AmericaNorwayOECD membersOmanOther small statesPacific island small statesPakistanPalauPanamaPapua New GuineaParaguayPeruPhilippinesPolandPortugalPost-demographic dividendPre-demographic dividendPuerto RicoQatarRomaniaRussian FederationRwandaSamoaSan MarinoSao Tome and PrincipeSaudi ArabiaSenegalSerbiaSeychellesSierra LeoneSloveniaSmall statesSolomon IslandsSomaliaSouth AfricaSouth AsiaSouth Asia (IDA & IBRD)South SudanSpainSri LankaSt. Kitts and NevisSt. LuciaSt. Vincent and the GrenadinesSub-Saharan Africa Sub-Saharan Africa (excluding high income)Sub-Saharan Africa (IDA & IBRD countries)SudanSurinameSwazilandSwedenSwitzerlandSyrian Arab RepublicTajikistanTanzaniaThailandTimor-LesteTogoTongaTrinidad and TobagoTunisiaTurkeyTuvaluUgandaUkraineUnited Arab EmiratesUnited KingdomUnited StatesUpper middle incomeUruguayUzbekistanVanuatuVenezuela, RBVietnamWest Bank and GazaWorldYemen, Rep.ZambiaZimbabwe Timeline:
This timeline shows a graph from 1971 to 2015 of Post-demographic dividend. No data until 1970. Number of actual observations by date: 45.
Source name:
World Development Indicators
Source organization:
United Nations Educational, Scientific, and Cultural Organization (UNESCO) Institute for Statistics.
Categories, topics:
Education
Last updated:
apr 23, 2017
Indicators value changes by year
At the date of observation
Value
Absolute change
Change from previous value
jan 1, 1971
9.342
+9.342
0.0%
jan 1, 1972
9.267
-0.076
-0.81%
jan 1, 1973
9.377
+0.111
1.2%
jan 1, 1974
8.99
-0.388
-4.13%
jan 1, 1975
9.268
+0.278
3.1%
jan 1, 1976
8.831
-0.438
-4.72%
jan 1, 1977
8.05
-0.781
-8.84%
jan 1, 1978
7.83
-0.22
-2.73%
jan 1, 1979
7.407
-0.423
-5.4%
jan 1, 1980
7.208
-0.198
-2.68%
jan 1, 1981
4.838
-2.37
-32.88%
jan 1, 1982
4.912
+0.074
1.54%
jan 1, 1983
4.337
-0.575
-11.71%
jan 1, 1984
4.946
+0.608
14.03%
jan 1, 1985
5.314
+0.368
7.44%
jan 1, 1986
5.318
+0.004
0.08%
jan 1, 1987
4.616
-0.702
-13.2%
jan 1, 1988
3.982
-0.634
-13.74%
jan 1, 1989
3.515
-0.467
-11.72%
jan 1, 1990
3.221
-0.294
-8.36%
jan 1, 1991
2.964
-0.257
-7.98%
jan 1, 1992
2.717
-0.248
-8.35%
jan 1, 1993
3.255
+0.538
19.82%
jan 1, 1994
3.546
+0.291
8.94%
jan 1, 1995
3.537
-0.009
-0.25%
jan 1, 1996
3.029
-0.508
-14.36%
jan 1, 1997
3.006
-0.024
-0.78%
jan 1, 1998
2.6
-0.406
-13.5%
jan 1, 1999
1.952
-0.648
-24.91%
jan 1, 2000
1.731
-0.221
-11.33%
jan 1, 2001
1.69
-0.042
-2.4%
jan 1, 2002
1.727
+0.037
2.2%
jan 1, 2003
2.179
+0.453
26.21%
jan 1, 2004
2.613
+0.433
19.88%
jan 1, 2005
3.176
+0.563
21.54%
jan 1, 2006
2.89
-0.286
-9.01%
jan 1, 2007
2.491
-0.399
-13.81%
jan 1, 2008
2.125
-0.365
-14.67%
jan 1, 2009
1.866
-0.259
-12.21%
jan 1, 2010
2.336
+0.47
25.19%
jan 1, 2011
2.655
+0.32
13.69%
jan 1, 2012
2.91
+0.254
9.58%
jan 1, 2013
2.792
-0.118
-4.04%
jan 1, 2014
3.408
+0.616
22.04%
jan 1, 2015
3.078
-0.329
-9.67%
Ranking of countries by current statistics by years


Comments: