29
/
en
AIzaSyAYiBZKx7MnpbEhh9jyipgxe19OcubqV5w
April 1, 2024
193961
Mauritius
MUS
true
2
1
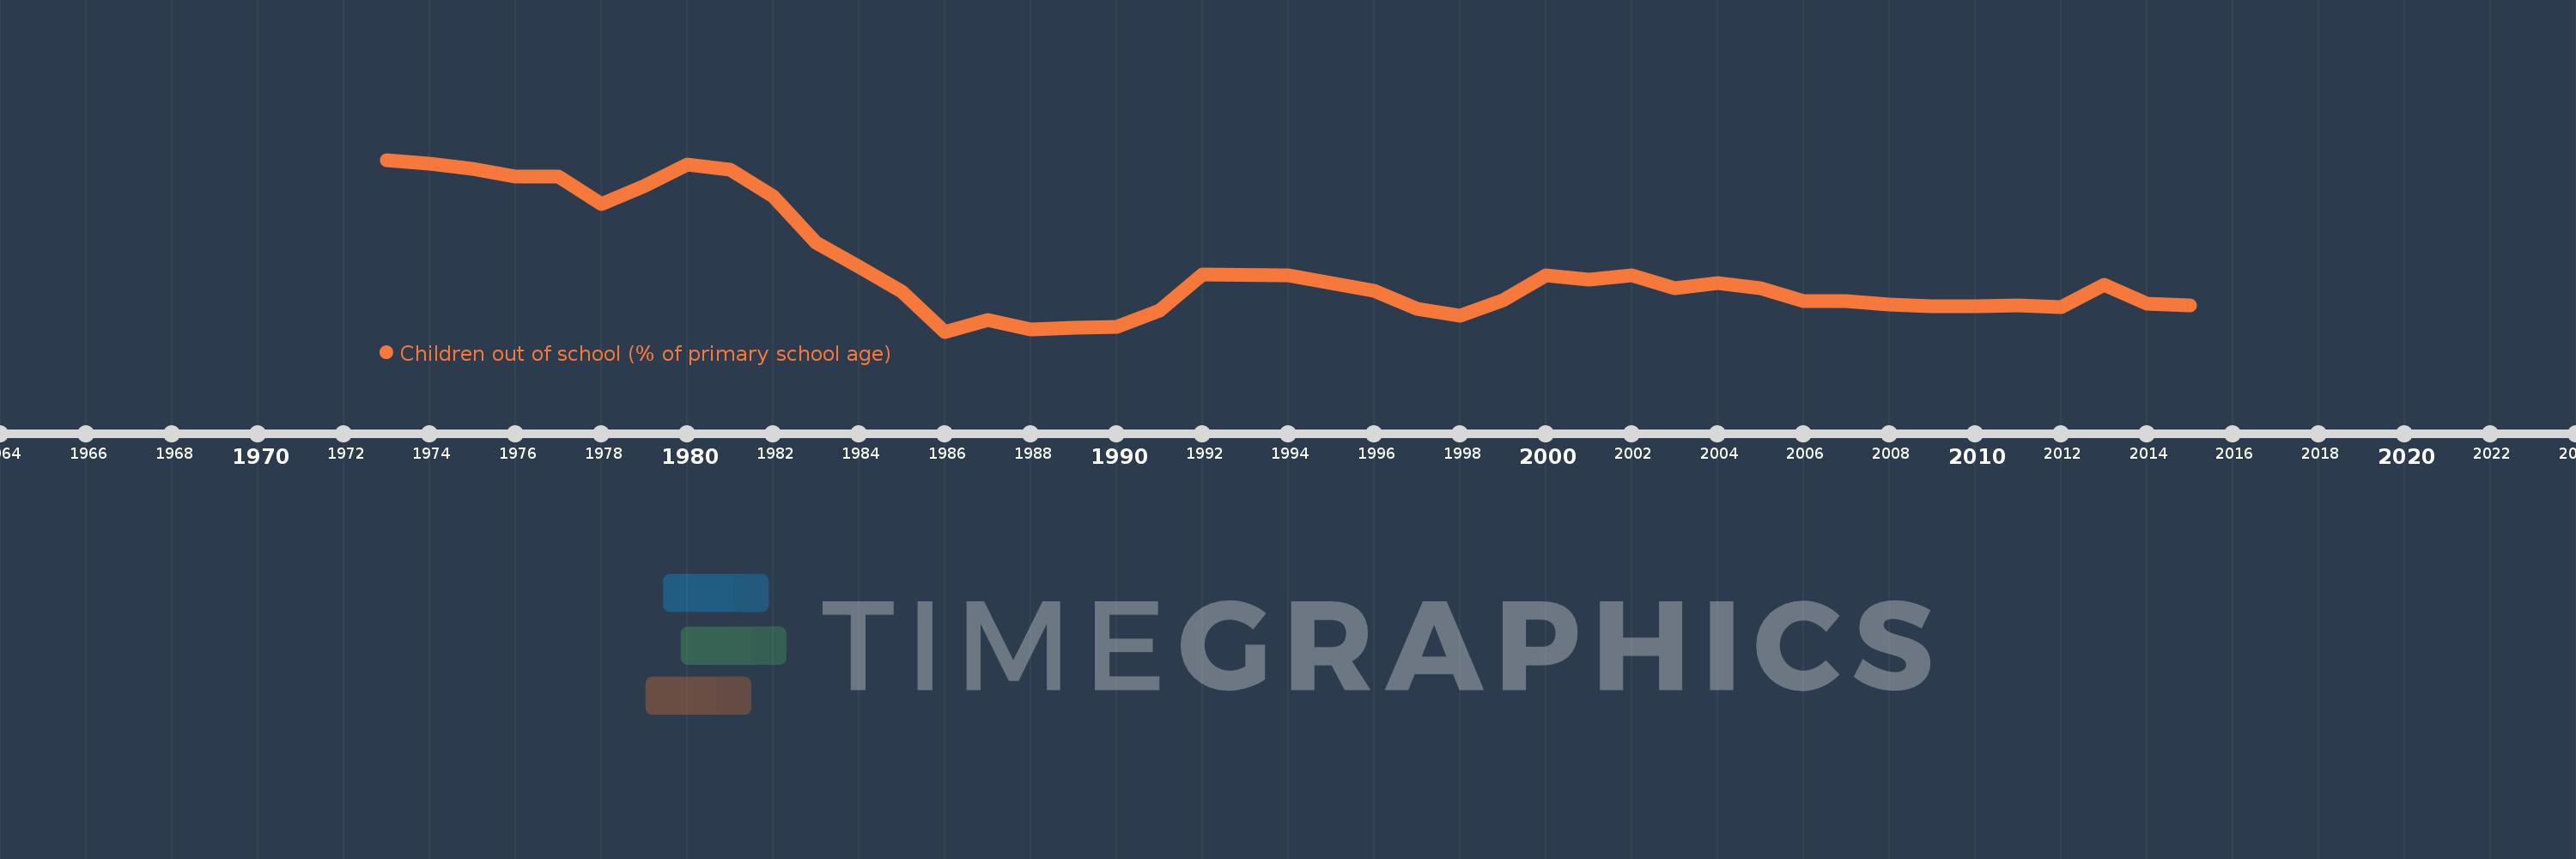
Children out of school (% of primary school age)
2015,2014,2013,2012,2011,2010,2009,2008,2007,2006,2005,2004,2003,2002,2001,2000,1999,1998,1997,1996,1995,1994,1992,1991,1990,1989,1988,1987,1986,1985,1984,1983,1982,1981,1980,1979,1978,1977,1976,1975,1974,1973
This statistics in other country:
AfghanistanAlbaniaAlgeriaAngolaAntigua and BarbudaArab WorldArgentinaArmeniaArubaAustraliaAustriaAzerbaijanBahamas, TheBahrainBangladeshBarbadosBelarusBelgiumBelizeBeninBermudaBhutanBoliviaBosnia and HerzegovinaBotswanaBrazilBrunei DarussalamBulgariaBurkina FasoBurundiCabo VerdeCambodiaCameroonCanadaCaribbean small statesCentral African RepublicCentral Europe and the BalticsChadChileChinaColombiaComorosCongo, Dem. Rep.Congo, Rep.Costa RicaCote d'IvoireCroatiaCubaCyprusDenmarkDjiboutiDominicaDominican RepublicEarly-demographic dividendEast Asia & PacificEast Asia & Pacific (excluding high income)East Asia & Pacific (IDA & IBRD countries)EcuadorEgypt, Arab Rep.El SalvadorEquatorial GuineaEritreaEstoniaEthiopiaEuro areaEurope & Central AsiaEurope & Central Asia (excluding high income)Europe & Central Asia (IDA & IBRD countries)European UnionFijiFinlandFragile and conflict affected situationsFranceGabonGambia, TheGeorgiaGermanyGhanaGreeceGrenadaGuatemalaGuineaGuinea-BissauGuyanaHaitiHeavily indebted poor countries (HIPC)High incomeHondurasHong Kong SAR, ChinaHungaryIBRD onlyIcelandIDA & IBRD totalIDA blendIDA onlyIDA totalIndiaIndonesiaIran, Islamic Rep.IraqIrelandIsraelItalyJamaicaJapanJordanKazakhstanKenyaKiribatiKorea, Dem. People’s Rep.Korea, Rep.KuwaitKyrgyz RepublicLao PDRLate-demographic dividendLatin America & Caribbean Latin America & Caribbean (excluding high income)Latin America & the Caribbean (IDA & IBRD countries)LatviaLeast developed countries: UN classificationLebanonLesothoLiberiaLibyaLiechtensteinLithuaniaLow & middle incomeLow incomeLower middle incomeLuxembourgMacao SAR, ChinaMacedonia, FYRMadagascarMalawiMalaysiaMaldivesMaliMaltaMarshall IslandsMauritaniaMauritiusMexicoMicronesia, Fed. Sts.Middle East & North AfricaMiddle East & North Africa (excluding high income)Middle East & North Africa (IDA & IBRD countries)Middle incomeMoldovaMongoliaMontenegroMoroccoMozambiqueMyanmarNamibiaNauruNepalNetherlandsNew ZealandNicaraguaNigerNigeriaNorth AmericaNorwayOECD membersOmanOther small statesPacific island small statesPakistanPalauPanamaPapua New GuineaParaguayPeruPhilippinesPolandPortugalPost-demographic dividendPre-demographic dividendPuerto RicoQatarRomaniaRussian FederationRwandaSamoaSan MarinoSao Tome and PrincipeSaudi ArabiaSenegalSerbiaSeychellesSierra LeoneSloveniaSmall statesSolomon IslandsSomaliaSouth AfricaSouth AsiaSouth Asia (IDA & IBRD)South SudanSpainSri LankaSt. Kitts and NevisSt. LuciaSt. Vincent and the GrenadinesSub-Saharan Africa Sub-Saharan Africa (excluding high income)Sub-Saharan Africa (IDA & IBRD countries)SudanSurinameSwazilandSwedenSwitzerlandSyrian Arab RepublicTajikistanTanzaniaThailandTimor-LesteTogoTongaTrinidad and TobagoTunisiaTurkeyTuvaluUgandaUkraineUnited Arab EmiratesUnited KingdomUnited StatesUpper middle incomeUruguayUzbekistanVanuatuVenezuela, RBVietnamWest Bank and GazaWorldYemen, Rep.ZambiaZimbabwe Timeline:
This timeline shows a graph from 1973 to 2015 of Mauritius. No data until 1972. Number of actual observations by date: 42.
Source name:
World Development Indicators
Source organization:
United Nations Educational, Scientific, and Cultural Organization (UNESCO) Institute for Statistics.
Categories, topics:
Education
Last updated:
apr 23, 2017
Indicators value changes by year
Maximum:
22.049
jan 1, 1973
At the date of observation
Value
Absolute change
Change from previous value
jan 1, 1973
22.049
+22.049
0.0%
jan 1, 1974
21.512
-0.537
-2.44%
jan 1, 1975
20.922
-0.59
-2.74%
jan 1, 1976
19.944
-0.978
-4.67%
jan 1, 1977
19.888
-0.057
-0.28%
jan 1, 1978
16.404
-3.483
-17.52%
jan 1, 1979
18.696
+2.292
13.97%
jan 1, 1980
21.395
+2.699
14.44%
jan 1, 1981
20.739
-0.656
-3.07%
jan 1, 1982
17.426
-3.313
-15.98%
jan 1, 1983
11.489
-5.937
-34.07%
jan 1, 1984
8.367
-3.122
-27.17%
jan 1, 1985
5.182
-3.185
-38.07%
jan 1, 1986
0.091
-5.091
-98.24%
jan 1, 1987
1.586
+1.495
1.64K%
jan 1, 1988
0.35
-1.236
-77.94%
jan 1, 1989
0.545
+0.195
55.72%
jan 1, 1990
0.674
+0.129
23.62%
jan 1, 1991
2.822
+2.148
318.82%
jan 1, 1992
7.378
+4.556
161.46%
jan 1, 1994
7.238
-0.14
-1.9%
jan 1, 1995
6.262
-0.976
-13.48%
jan 1, 1996
5.318
-0.944
-15.08%
jan 1, 1997
3.019
-2.299
-43.23%
jan 1, 1998
2.097
-0.922
-30.54%
jan 1, 1999
4.121
+2.024
96.5%
jan 1, 2000
7.243
+3.122
75.76%
jan 1, 2001
6.773
-0.47
-6.49%
jan 1, 2002
7.246
+0.473
6.98%
jan 1, 2003
5.664
-1.583
-21.84%
jan 1, 2004
6.271
+0.608
10.73%
jan 1, 2005
5.619
-0.652
-10.4%
jan 1, 2006
3.979
-1.64
-29.19%
jan 1, 2007
3.97
-0.01
-0.24%
jan 1, 2008
3.501
-0.469
-11.81%
jan 1, 2009
3.352
-0.149
-4.25%
jan 1, 2010
3.34
-0.012
-0.35%
jan 1, 2011
3.491
+0.151
4.53%
jan 1, 2012
3.264
-0.227
-6.5%
jan 1, 2013
6.048
+2.784
85.28%
jan 1, 2014
3.663
-2.385
-39.44%
jan 1, 2015
3.447
-0.216
-5.9%
Ranking of countries by current statistics by years


Comments: