29
/
en
AIzaSyAYiBZKx7MnpbEhh9jyipgxe19OcubqV5w
April 1, 2024
57907
South Asia (IDA & IBRD)
TSA
false
2
1
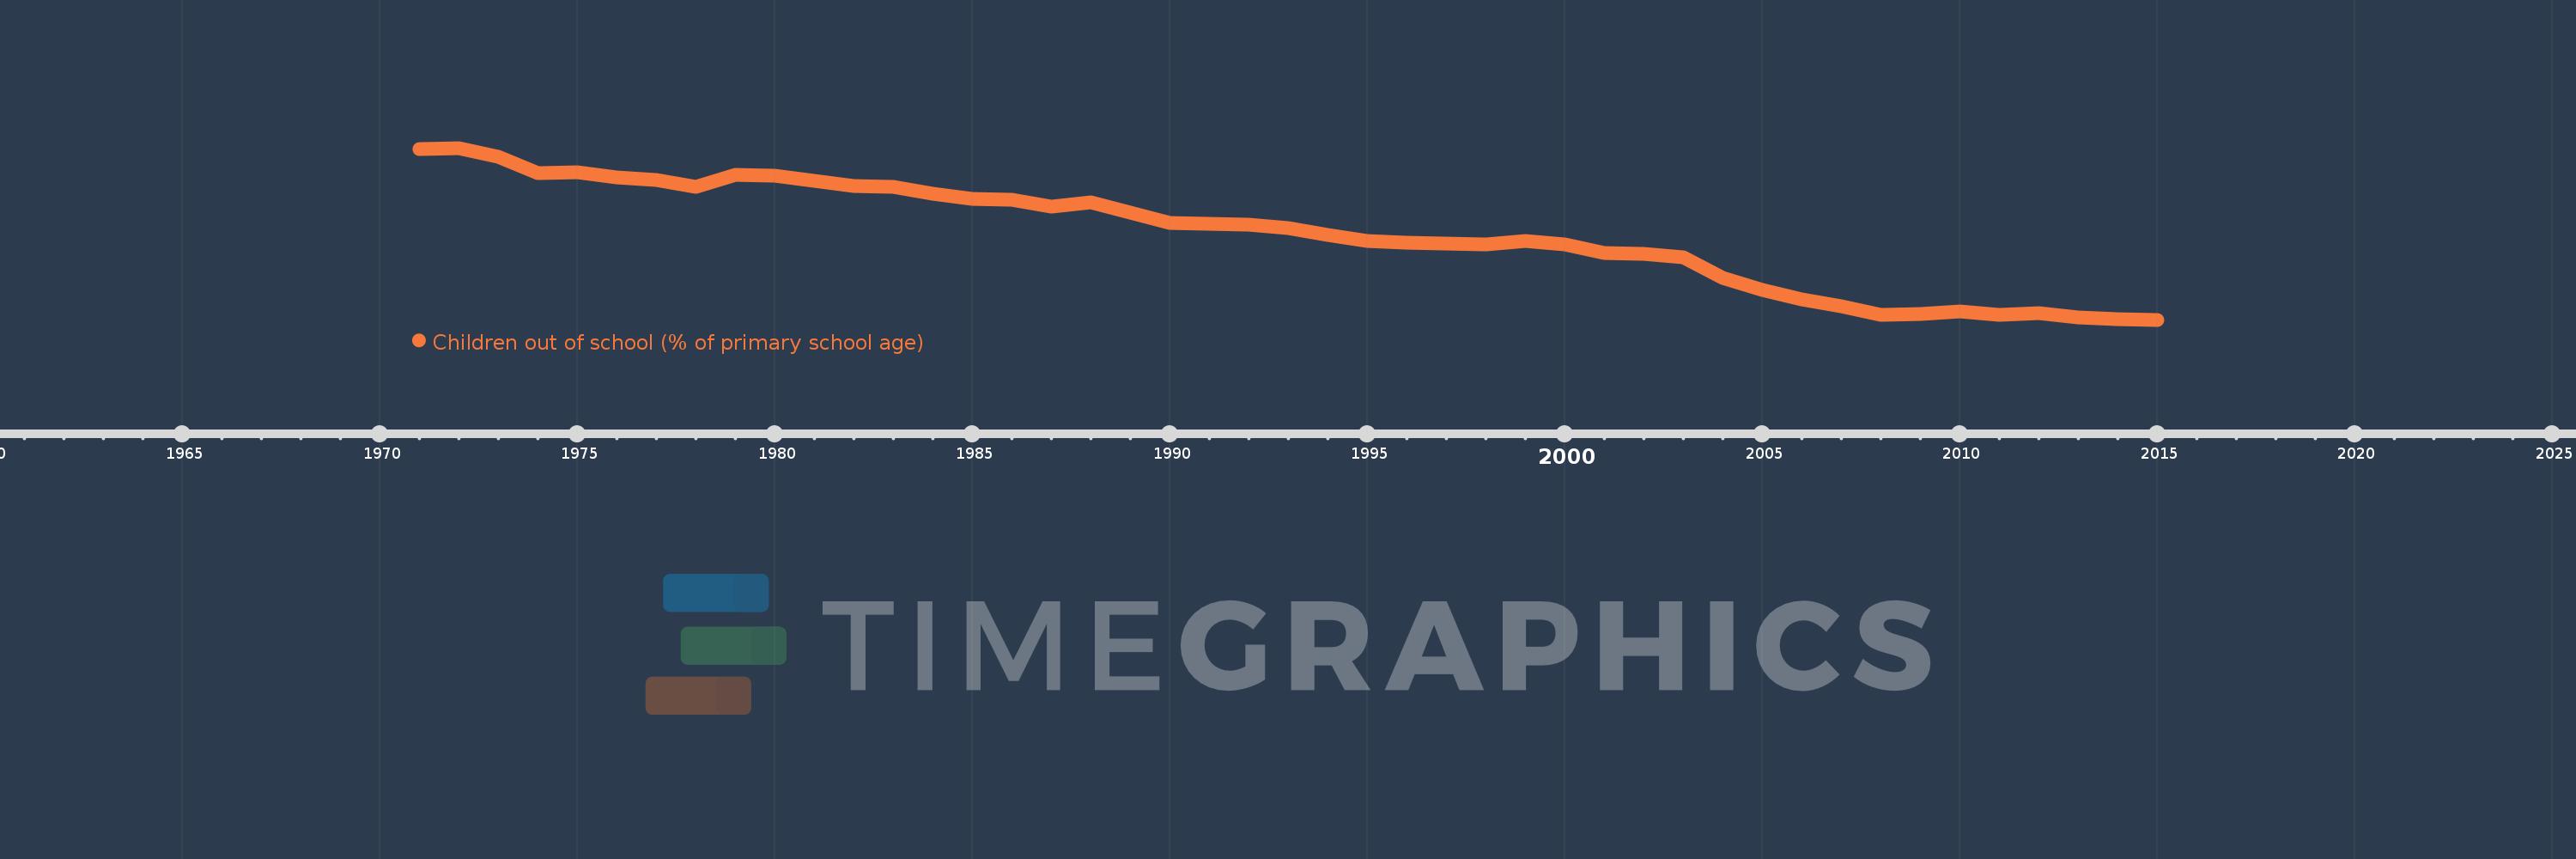
Children out of school (% of primary school age)
2015,2014,2013,2012,2011,2010,2009,2008,2007,2006,2005,2004,2003,2002,2001,2000,1999,1998,1997,1996,1995,1994,1993,1992,1991,1990,1989,1988,1987,1986,1985,1984,1983,1982,1981,1980,1979,1978,1977,1976,1975,1974,1973,1972,1971
This statistics in other country:
AfghanistanAlbaniaAlgeriaAngolaAntigua and BarbudaArab WorldArgentinaArmeniaArubaAustraliaAustriaAzerbaijanBahamas, TheBahrainBangladeshBarbadosBelarusBelgiumBelizeBeninBermudaBhutanBoliviaBosnia and HerzegovinaBotswanaBrazilBrunei DarussalamBulgariaBurkina FasoBurundiCabo VerdeCambodiaCameroonCanadaCaribbean small statesCentral African RepublicCentral Europe and the BalticsChadChileChinaColombiaComorosCongo, Dem. Rep.Congo, Rep.Costa RicaCote d'IvoireCroatiaCubaCyprusDenmarkDjiboutiDominicaDominican RepublicEarly-demographic dividendEast Asia & PacificEast Asia & Pacific (excluding high income)East Asia & Pacific (IDA & IBRD countries)EcuadorEgypt, Arab Rep.El SalvadorEquatorial GuineaEritreaEstoniaEthiopiaEuro areaEurope & Central AsiaEurope & Central Asia (excluding high income)Europe & Central Asia (IDA & IBRD countries)European UnionFijiFinlandFragile and conflict affected situationsFranceGabonGambia, TheGeorgiaGermanyGhanaGreeceGrenadaGuatemalaGuineaGuinea-BissauGuyanaHaitiHeavily indebted poor countries (HIPC)High incomeHondurasHong Kong SAR, ChinaHungaryIBRD onlyIcelandIDA & IBRD totalIDA blendIDA onlyIDA totalIndiaIndonesiaIran, Islamic Rep.IraqIrelandIsraelItalyJamaicaJapanJordanKazakhstanKenyaKiribatiKorea, Dem. People’s Rep.Korea, Rep.KuwaitKyrgyz RepublicLao PDRLate-demographic dividendLatin America & Caribbean Latin America & Caribbean (excluding high income)Latin America & the Caribbean (IDA & IBRD countries)LatviaLeast developed countries: UN classificationLebanonLesothoLiberiaLibyaLiechtensteinLithuaniaLow & middle incomeLow incomeLower middle incomeLuxembourgMacao SAR, ChinaMacedonia, FYRMadagascarMalawiMalaysiaMaldivesMaliMaltaMarshall IslandsMauritaniaMauritiusMexicoMicronesia, Fed. Sts.Middle East & North AfricaMiddle East & North Africa (excluding high income)Middle East & North Africa (IDA & IBRD countries)Middle incomeMoldovaMongoliaMontenegroMoroccoMozambiqueMyanmarNamibiaNauruNepalNetherlandsNew ZealandNicaraguaNigerNigeriaNorth AmericaNorwayOECD membersOmanOther small statesPacific island small statesPakistanPalauPanamaPapua New GuineaParaguayPeruPhilippinesPolandPortugalPost-demographic dividendPre-demographic dividendPuerto RicoQatarRomaniaRussian FederationRwandaSamoaSan MarinoSao Tome and PrincipeSaudi ArabiaSenegalSerbiaSeychellesSierra LeoneSloveniaSmall statesSolomon IslandsSomaliaSouth AfricaSouth AsiaSouth Asia (IDA & IBRD)South SudanSpainSri LankaSt. Kitts and NevisSt. LuciaSt. Vincent and the GrenadinesSub-Saharan Africa Sub-Saharan Africa (excluding high income)Sub-Saharan Africa (IDA & IBRD countries)SudanSurinameSwazilandSwedenSwitzerlandSyrian Arab RepublicTajikistanTanzaniaThailandTimor-LesteTogoTongaTrinidad and TobagoTunisiaTurkeyTuvaluUgandaUkraineUnited Arab EmiratesUnited KingdomUnited StatesUpper middle incomeUruguayUzbekistanVanuatuVenezuela, RBVietnamWest Bank and GazaWorldYemen, Rep.ZambiaZimbabwe Timeline:
This timeline shows a graph from 1971 to 2015 of South Asia (IDA & IBRD). No data until 1970. Number of actual observations by date: 45.
Source name:
World Development Indicators
Source organization:
United Nations Educational, Scientific, and Cultural Organization (UNESCO) Institute for Statistics.
Categories, topics:
Education
Last updated:
apr 23, 2017
Indicators value changes by year
Maximum:
42.786
jan 1, 1972
At the date of observation
Value
Absolute change
Change from previous value
jan 1, 1971
42.51
+42.51
0.0%
jan 1, 1972
42.786
+0.276
0.65%
jan 1, 1973
40.888
-1.898
-4.44%
jan 1, 1974
37.536
-3.352
-8.2%
jan 1, 1975
37.733
+0.198
0.53%
jan 1, 1976
36.523
-1.211
-3.21%
jan 1, 1977
36.087
-0.436
-1.19%
jan 1, 1978
34.58
-1.507
-4.18%
jan 1, 1979
37.011
+2.431
7.03%
jan 1, 1980
36.843
-0.168
-0.45%
jan 1, 1981
35.751
-1.093
-2.97%
jan 1, 1982
34.721
-1.029
-2.88%
jan 1, 1983
34.62
-0.101
-0.29%
jan 1, 1984
33.101
-1.519
-4.39%
jan 1, 1985
31.948
-1.153
-3.48%
jan 1, 1986
31.839
-0.109
-0.34%
jan 1, 1987
30.309
-1.53
-4.8%
jan 1, 1988
31.377
+1.068
3.52%
jan 1, 1989
29.139
-2.237
-7.13%
jan 1, 1990
26.918
-2.221
-7.62%
jan 1, 1991
26.751
-0.168
-0.62%
jan 1, 1992
26.493
-0.258
-0.96%
jan 1, 1993
25.836
-0.657
-2.48%
jan 1, 1994
24.337
-1.499
-5.8%
jan 1, 1995
23.049
-1.287
-5.29%
jan 1, 1996
22.804
-0.246
-1.07%
jan 1, 1997
22.516
-0.288
-1.26%
jan 1, 1998
22.435
-0.08
-0.36%
jan 1, 1999
23.131
+0.695
3.1%
jan 1, 2000
22.355
-0.776
-3.36%
jan 1, 2001
20.584
-1.77
-7.92%
jan 1, 2002
20.437
-0.147
-0.72%
jan 1, 2003
19.609
-0.828
-4.05%
jan 1, 2004
15.307
-4.302
-21.94%
jan 1, 2005
12.756
-2.55
-16.66%
jan 1, 2006
10.852
-1.904
-14.93%
jan 1, 2007
9.379
-1.473
-13.58%
jan 1, 2008
7.457
-1.921
-20.49%
jan 1, 2009
7.591
+0.134
1.8%
jan 1, 2010
8.26
+0.669
8.82%
jan 1, 2011
7.521
-0.739
-8.94%
jan 1, 2012
7.926
+0.405
5.38%
jan 1, 2013
7.011
-0.915
-11.54%
jan 1, 2014
6.665
-0.346
-4.93%
jan 1, 2015
6.462
-0.203
-3.05%
Ranking of countries by current statistics by years


Comments: