29
/
en
AIzaSyAYiBZKx7MnpbEhh9jyipgxe19OcubqV5w
April 1, 2024
81539
Belgium
BEL
true
2
1
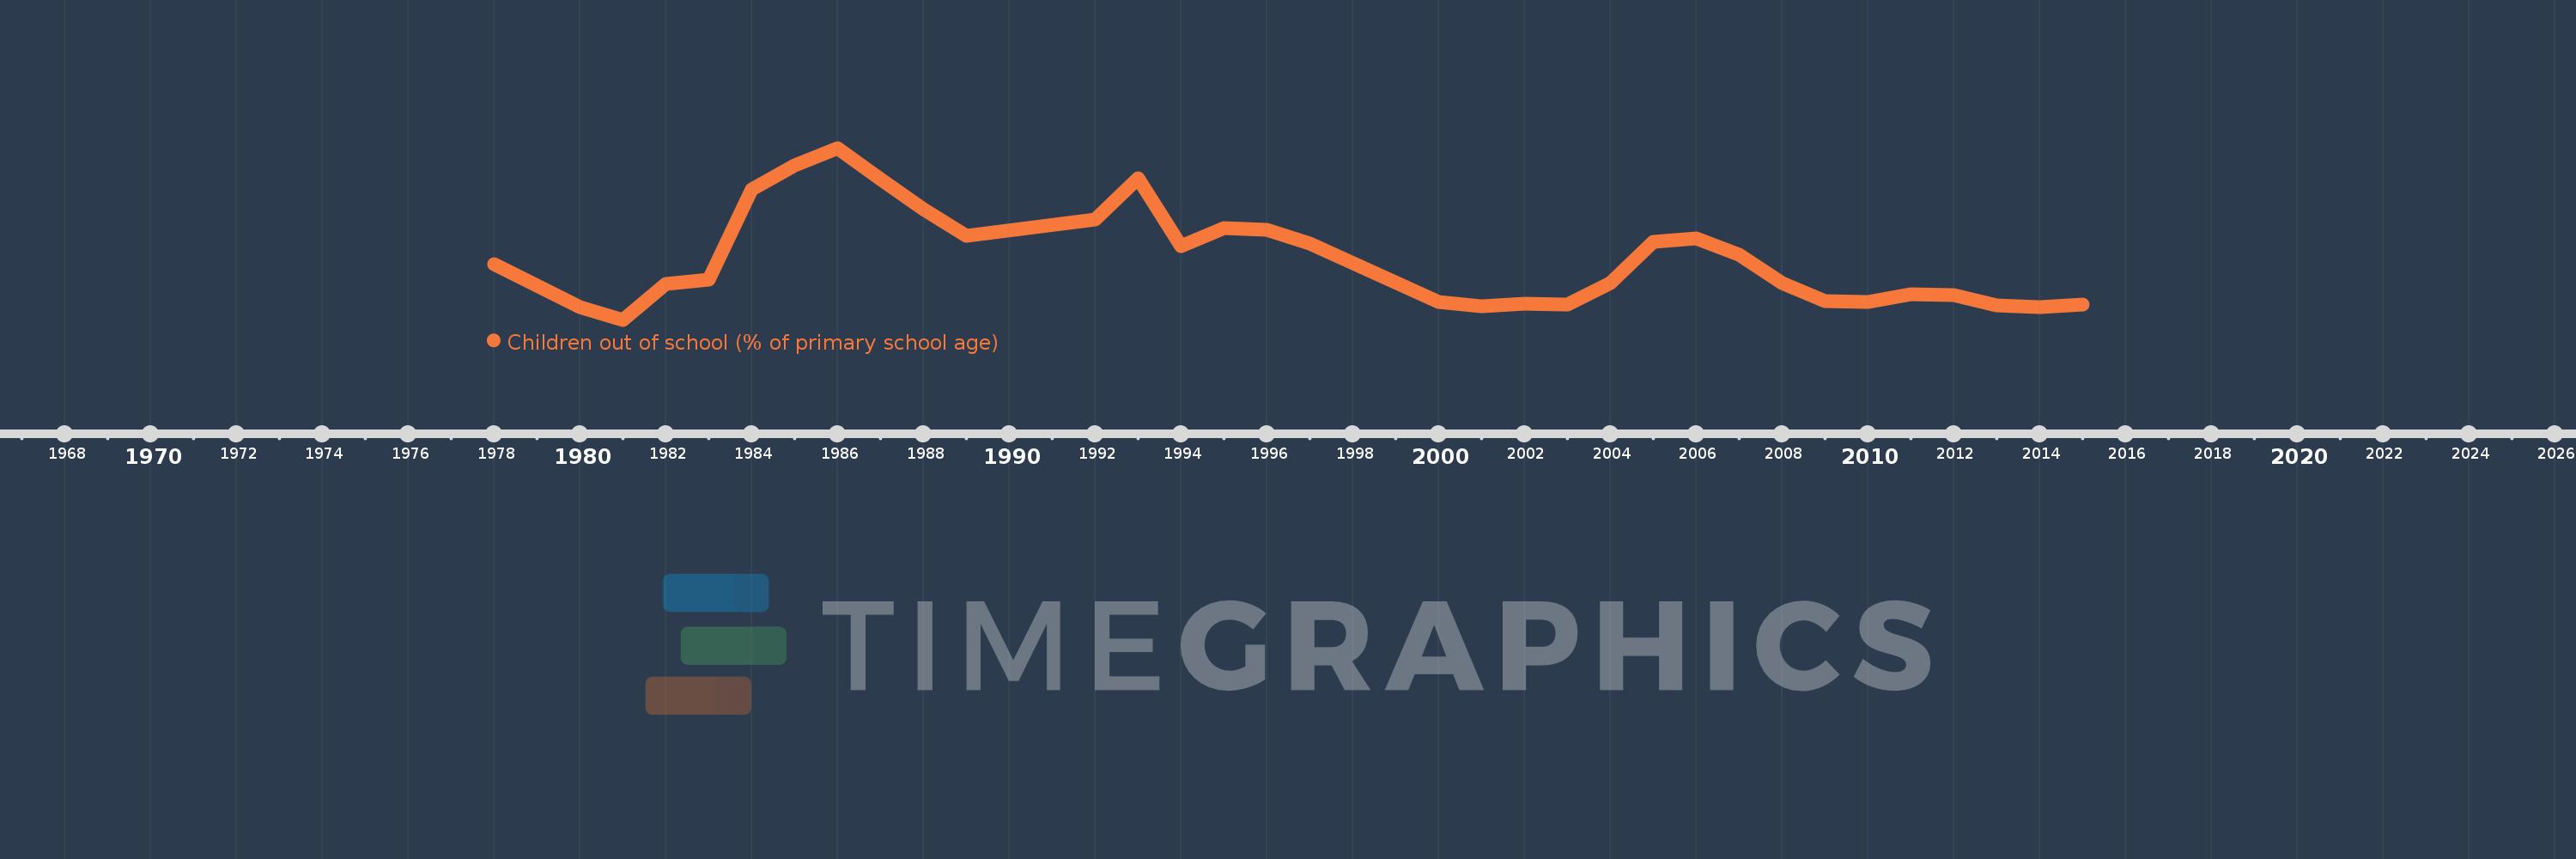
Children out of school (% of primary school age)
2015,2014,2013,2012,2011,2010,2009,2008,2007,2006,2005,2004,2003,2002,2001,2000,1997,1996,1995,1994,1993,1992,1989,1988,1987,1986,1985,1984,1983,1982,1981,1980,1978
This statistics in other country:
AfghanistanAlbaniaAlgeriaAngolaAntigua and BarbudaArab WorldArgentinaArmeniaArubaAustraliaAustriaAzerbaijanBahamas, TheBahrainBangladeshBarbadosBelarusBelgiumBelizeBeninBermudaBhutanBoliviaBosnia and HerzegovinaBotswanaBrazilBrunei DarussalamBulgariaBurkina FasoBurundiCabo VerdeCambodiaCameroonCanadaCaribbean small statesCentral African RepublicCentral Europe and the BalticsChadChileChinaColombiaComorosCongo, Dem. Rep.Congo, Rep.Costa RicaCote d'IvoireCroatiaCubaCyprusDenmarkDjiboutiDominicaDominican RepublicEarly-demographic dividendEast Asia & PacificEast Asia & Pacific (excluding high income)East Asia & Pacific (IDA & IBRD countries)EcuadorEgypt, Arab Rep.El SalvadorEquatorial GuineaEritreaEstoniaEthiopiaEuro areaEurope & Central AsiaEurope & Central Asia (excluding high income)Europe & Central Asia (IDA & IBRD countries)European UnionFijiFinlandFragile and conflict affected situationsFranceGabonGambia, TheGeorgiaGermanyGhanaGreeceGrenadaGuatemalaGuineaGuinea-BissauGuyanaHaitiHeavily indebted poor countries (HIPC)High incomeHondurasHong Kong SAR, ChinaHungaryIBRD onlyIcelandIDA & IBRD totalIDA blendIDA onlyIDA totalIndiaIndonesiaIran, Islamic Rep.IraqIrelandIsraelItalyJamaicaJapanJordanKazakhstanKenyaKiribatiKorea, Dem. People’s Rep.Korea, Rep.KuwaitKyrgyz RepublicLao PDRLate-demographic dividendLatin America & Caribbean Latin America & Caribbean (excluding high income)Latin America & the Caribbean (IDA & IBRD countries)LatviaLeast developed countries: UN classificationLebanonLesothoLiberiaLibyaLiechtensteinLithuaniaLow & middle incomeLow incomeLower middle incomeLuxembourgMacao SAR, ChinaMacedonia, FYRMadagascarMalawiMalaysiaMaldivesMaliMaltaMarshall IslandsMauritaniaMauritiusMexicoMicronesia, Fed. Sts.Middle East & North AfricaMiddle East & North Africa (excluding high income)Middle East & North Africa (IDA & IBRD countries)Middle incomeMoldovaMongoliaMontenegroMoroccoMozambiqueMyanmarNamibiaNauruNepalNetherlandsNew ZealandNicaraguaNigerNigeriaNorth AmericaNorwayOECD membersOmanOther small statesPacific island small statesPakistanPalauPanamaPapua New GuineaParaguayPeruPhilippinesPolandPortugalPost-demographic dividendPre-demographic dividendPuerto RicoQatarRomaniaRussian FederationRwandaSamoaSan MarinoSao Tome and PrincipeSaudi ArabiaSenegalSerbiaSeychellesSierra LeoneSloveniaSmall statesSolomon IslandsSomaliaSouth AfricaSouth AsiaSouth Asia (IDA & IBRD)South SudanSpainSri LankaSt. Kitts and NevisSt. LuciaSt. Vincent and the GrenadinesSub-Saharan Africa Sub-Saharan Africa (excluding high income)Sub-Saharan Africa (IDA & IBRD countries)SudanSurinameSwazilandSwedenSwitzerlandSyrian Arab RepublicTajikistanTanzaniaThailandTimor-LesteTogoTongaTrinidad and TobagoTunisiaTurkeyTuvaluUgandaUkraineUnited Arab EmiratesUnited KingdomUnited StatesUpper middle incomeUruguayUzbekistanVanuatuVenezuela, RBVietnamWest Bank and GazaWorldYemen, Rep.ZambiaZimbabwe Timeline:
This timeline shows a graph from 1978 to 2015 of Belgium. No data until 1977. Number of actual observations by date: 33.
Source name:
World Development Indicators
Source organization:
United Nations Educational, Scientific, and Cultural Organization (UNESCO) Institute for Statistics.
Categories, topics:
Education
Last updated:
apr 23, 2017
Indicators value changes by year
At the date of observation
Value
Absolute change
Change from previous value
jan 1, 1978
2.387
+2.387
0.0%
jan 1, 1980
0.765
-1.622
-67.95%
jan 1, 1981
0.306
-0.46
-60.06%
jan 1, 1982
1.644
+1.339
438.05%
jan 1, 1983
1.8
+0.156
9.5%
jan 1, 1984
5.169
+3.368
187.1%
jan 1, 1985
6.055
+0.886
17.14%
jan 1, 1986
6.709
+0.654
10.79%
jan 1, 1987
5.558
-1.151
-17.15%
jan 1, 1988
4.432
-1.126
-20.26%
jan 1, 1989
3.423
-1.009
-22.76%
jan 1, 1992
4.053
+0.629
18.39%
jan 1, 1993
5.563
+1.51
37.26%
jan 1, 1994
3.065
-2.498
-44.91%
jan 1, 1995
3.711
+0.646
21.09%
jan 1, 1996
3.664
-0.047
-1.26%
jan 1, 1997
3.158
-0.507
-13.83%
jan 1, 2000
0.961
-2.197
-69.57%
jan 1, 2001
0.809
-0.152
-15.78%
jan 1, 2002
0.889
+0.079
9.8%
jan 1, 2003
0.859
-0.03
-3.33%
jan 1, 2004
1.688
+0.829
96.54%
jan 1, 2005
3.217
+1.529
90.55%
jan 1, 2006
3.352
+0.135
4.19%
jan 1, 2007
2.743
-0.609
-18.17%
jan 1, 2008
1.665
-1.077
-39.28%
jan 1, 2009
1.002
-0.663
-39.84%
jan 1, 2010
0.979
-0.023
-2.29%
jan 1, 2011
1.261
+0.282
28.82%
jan 1, 2012
1.228
-0.033
-2.65%
jan 1, 2013
0.853
-0.375
-30.55%
jan 1, 2014
0.792
-0.061
-7.16%
jan 1, 2015
0.886
+0.095
11.95%
Ranking of countries by current statistics by years


Comments: