30
/
AIzaSyAYiBZKx7MnpbEhh9jyipgxe19OcubqV5w
April 1, 2024
181889
Luxembourg
LUX
true
2
1
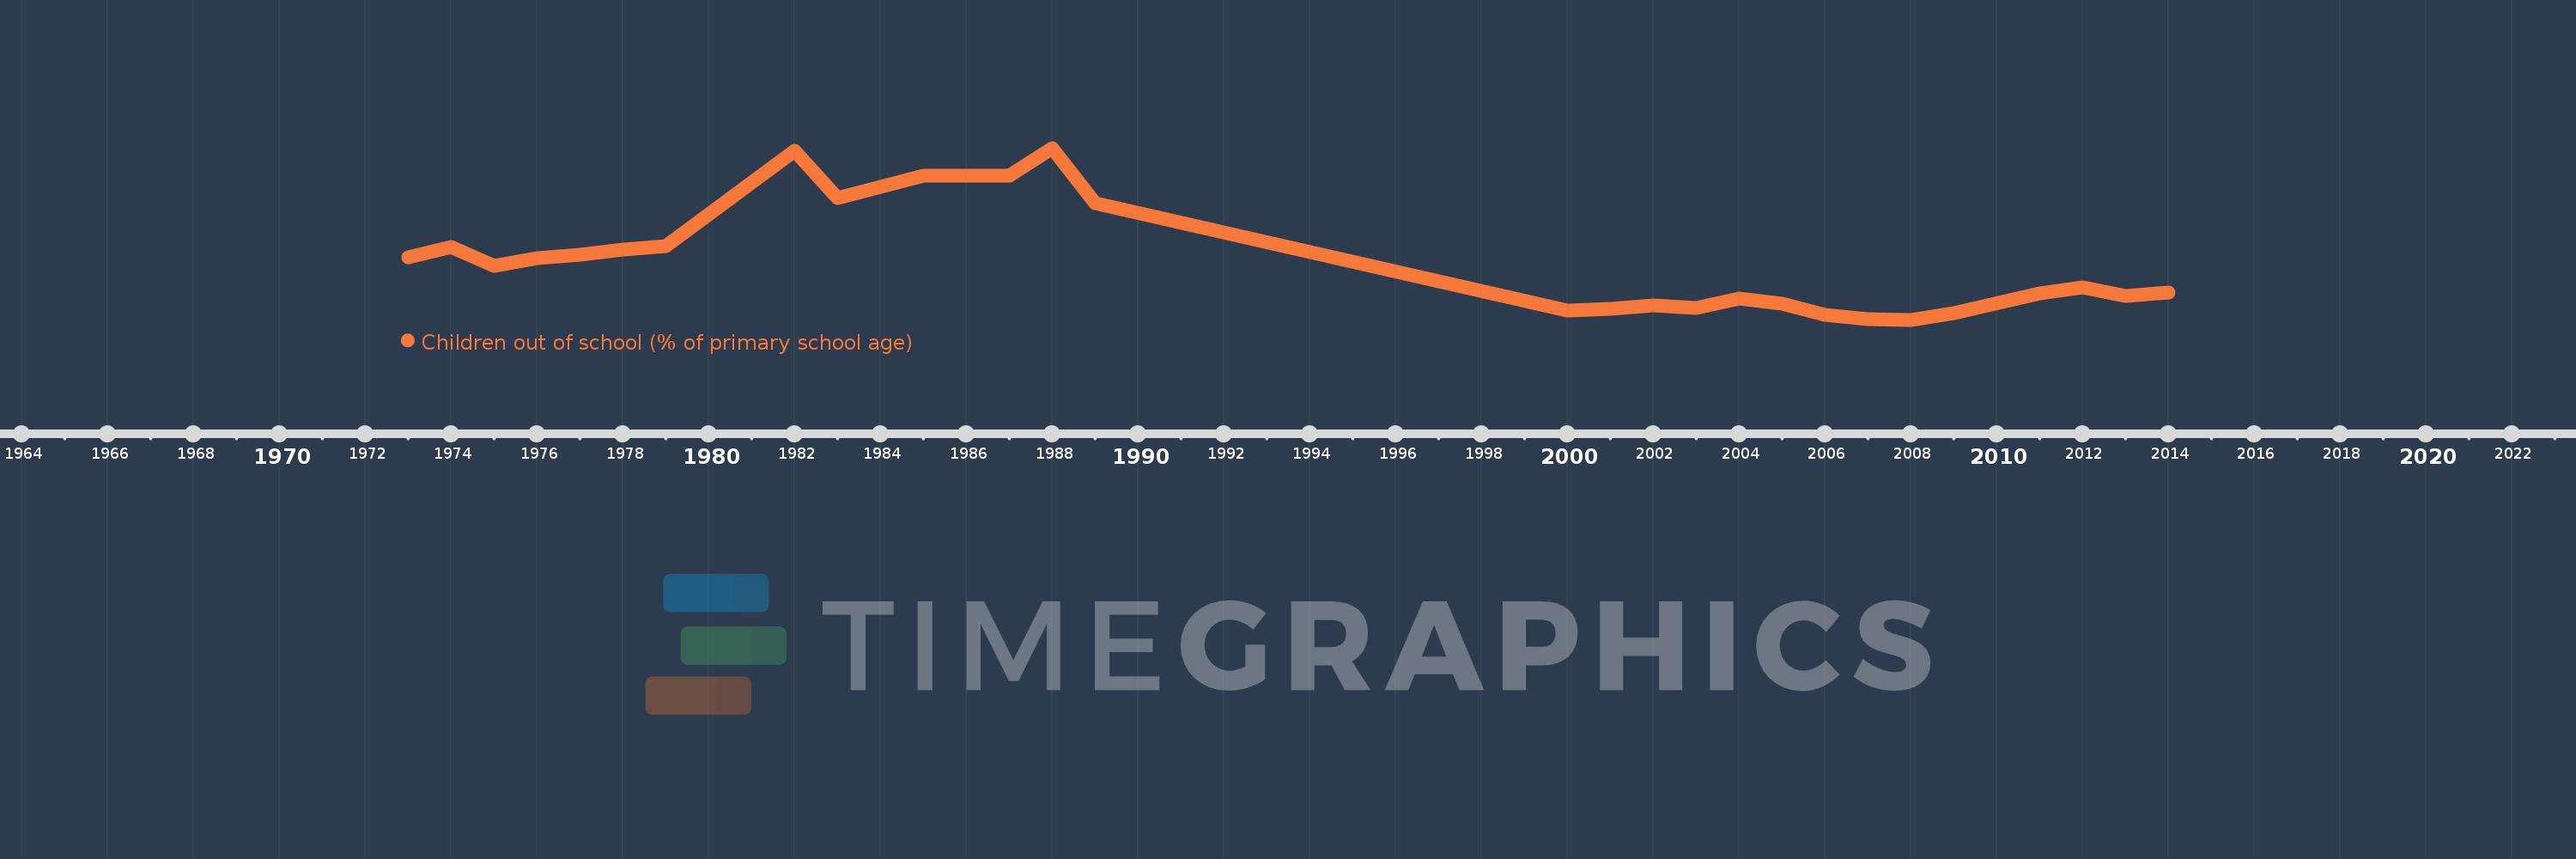
Children out of school (% of primary school age)
2014,2013,2012,2011,2009,2008,2007,2006,2005,2004,2003,2002,2001,2000,1989,1988,1987,1985,1984,1983,1982,1979,1978,1977,1976,1975,1974,1973
