29
/
en
AIzaSyAYiBZKx7MnpbEhh9jyipgxe19OcubqV5w
April 1, 2024
244449
Somalia
SOM
true
2
1
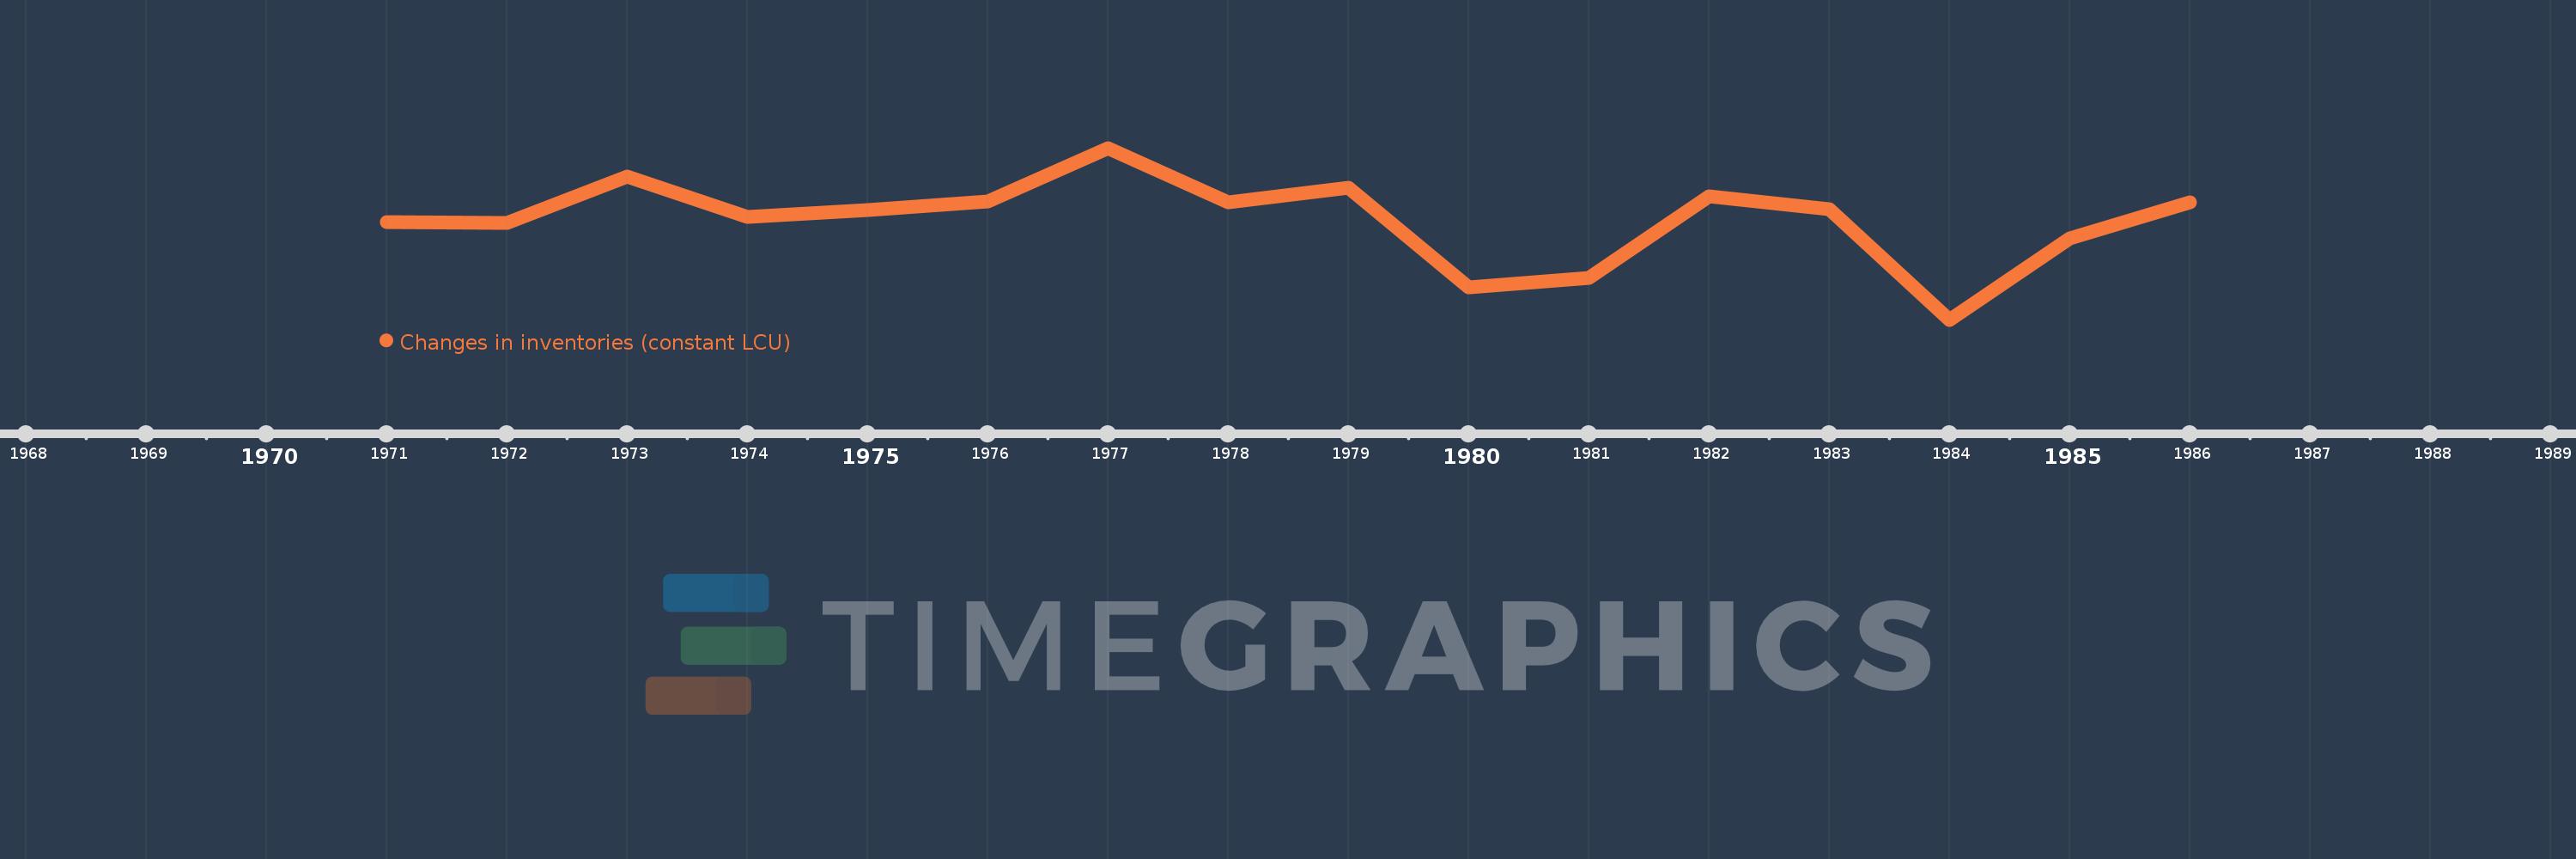
Changes in inventories (constant LCU)
1986,1985,1984,1983,1982,1981,1980,1979,1978,1977,1976,1975,1974,1973,1972,1971
This statistics in other country:
AlbaniaAlgeriaAngolaArgentinaArmeniaAustraliaAustriaAzerbaijanBahamas, TheBahrainBarbadosBelarusBelgiumBelizeBeninBhutanBoliviaBosnia and HerzegovinaBotswanaBrazilBrunei DarussalamBurkina FasoBurundiCabo VerdeCambodiaCameroonCanadaCentral African RepublicChadChileChinaColombiaComorosCongo, Dem. Rep.Congo, Rep.Cote d'IvoireCroatiaCubaCyprusCzech RepublicDenmarkDjiboutiDominican RepublicEcuadorEgypt, Arab Rep.El SalvadorEquatorial GuineaEritreaEstoniaFinlandFranceGabonGambia, TheGeorgiaGermanyGhanaGreeceGuatemalaGuineaGuinea-BissauHondurasHong Kong SAR, ChinaHungaryIcelandIndiaIndonesiaIran, Islamic Rep.IrelandItalyJamaicaJapanJordanKazakhstanKenyaKorea, Rep.KosovoKyrgyz RepublicLao PDRLatviaLebanonLiberiaLithuaniaLuxembourgMacao SAR, ChinaMacedonia, FYRMadagascarMalawiMalaysiaMaldivesMaliMauritaniaMauritiusMexicoMoldovaMongoliaMontenegroMoroccoMozambiqueNamibiaNepalNetherlandsNew ZealandNicaraguaNigerNigeriaNorwayOmanPakistanPanamaPapua New GuineaParaguayPeruPhilippinesPolandPortugalPuerto RicoRomaniaRussian FederationRwandaSaudi ArabiaSenegalSerbiaSeychellesSierra LeoneSingaporeSlovak RepublicSloveniaSomaliaSouth AfricaSouth SudanSpainSri LankaSudanSwazilandSwedenSwitzerlandSyrian Arab RepublicTajikistanTanzaniaThailandTimor-LesteTogoTrinidad and TobagoTunisiaTurkeyUgandaUkraineUnited Arab EmiratesUnited KingdomUnited StatesUruguayVanuatuVenezuela, RBVietnamWest Bank and GazaZambiaZimbabwe Timeline:
This timeline shows a graph from 1971 to 1986 of Somalia. No data until 1970. Number of actual observations by date: 16.
Source name:
World Development Indicators
Source organization:
World Bank national accounts data, and OECD National Accounts data files.
Categories, topics:
Economy & Growth
Last updated:
apr 23, 2017
Indicators value changes by year
Minimum:
-1.93 bln
jan 1, 1984
Maximum:
4.468 bln
jan 1, 1977
At the date of observation
Value
Absolute change
Change from previous value
jan 1, 1971
1.699 bln
+1.699 bln
0.0%
jan 1, 1972
1.671 bln
-28.009 mln
-1.65%
jan 1, 1973
3.394 bln
+1.723 bln
103.15%
jan 1, 1974
1.891 bln
-1.503 bln
-44.28%
jan 1, 1975
2.149 bln
+257.303 mln
13.6%
jan 1, 1976
2.477 bln
+328.597 mln
15.29%
jan 1, 1977
4.468 bln
+1.991 bln
80.37%
jan 1, 1978
2.456 bln
-2.012 bln
-45.03%
jan 1, 1979
2.99 bln
+534.0 mln
21.74%
jan 1, 1980
-734.0 mln
-3.724 bln
-124.55%
jan 1, 1981
-362.0 mln
+372.0 mln
-50.68%
jan 1, 1982
2.674 bln
+3.036 bln
-838.67%
jan 1, 1983
2.174 bln
-500.0 mln
-18.7%
jan 1, 1984
-1.93 bln
-4.104 bln
-188.78%
jan 1, 1985
1.099 bln
+3.029 bln
-156.94%
jan 1, 1986
2.446 bln
+1.347 bln
122.58%
Ranking of countries by current statistics by years


Comments: