29
/
en
AIzaSyAYiBZKx7MnpbEhh9jyipgxe19OcubqV5w
April 1, 2024
116674
Cyprus
CYP
true
2
1
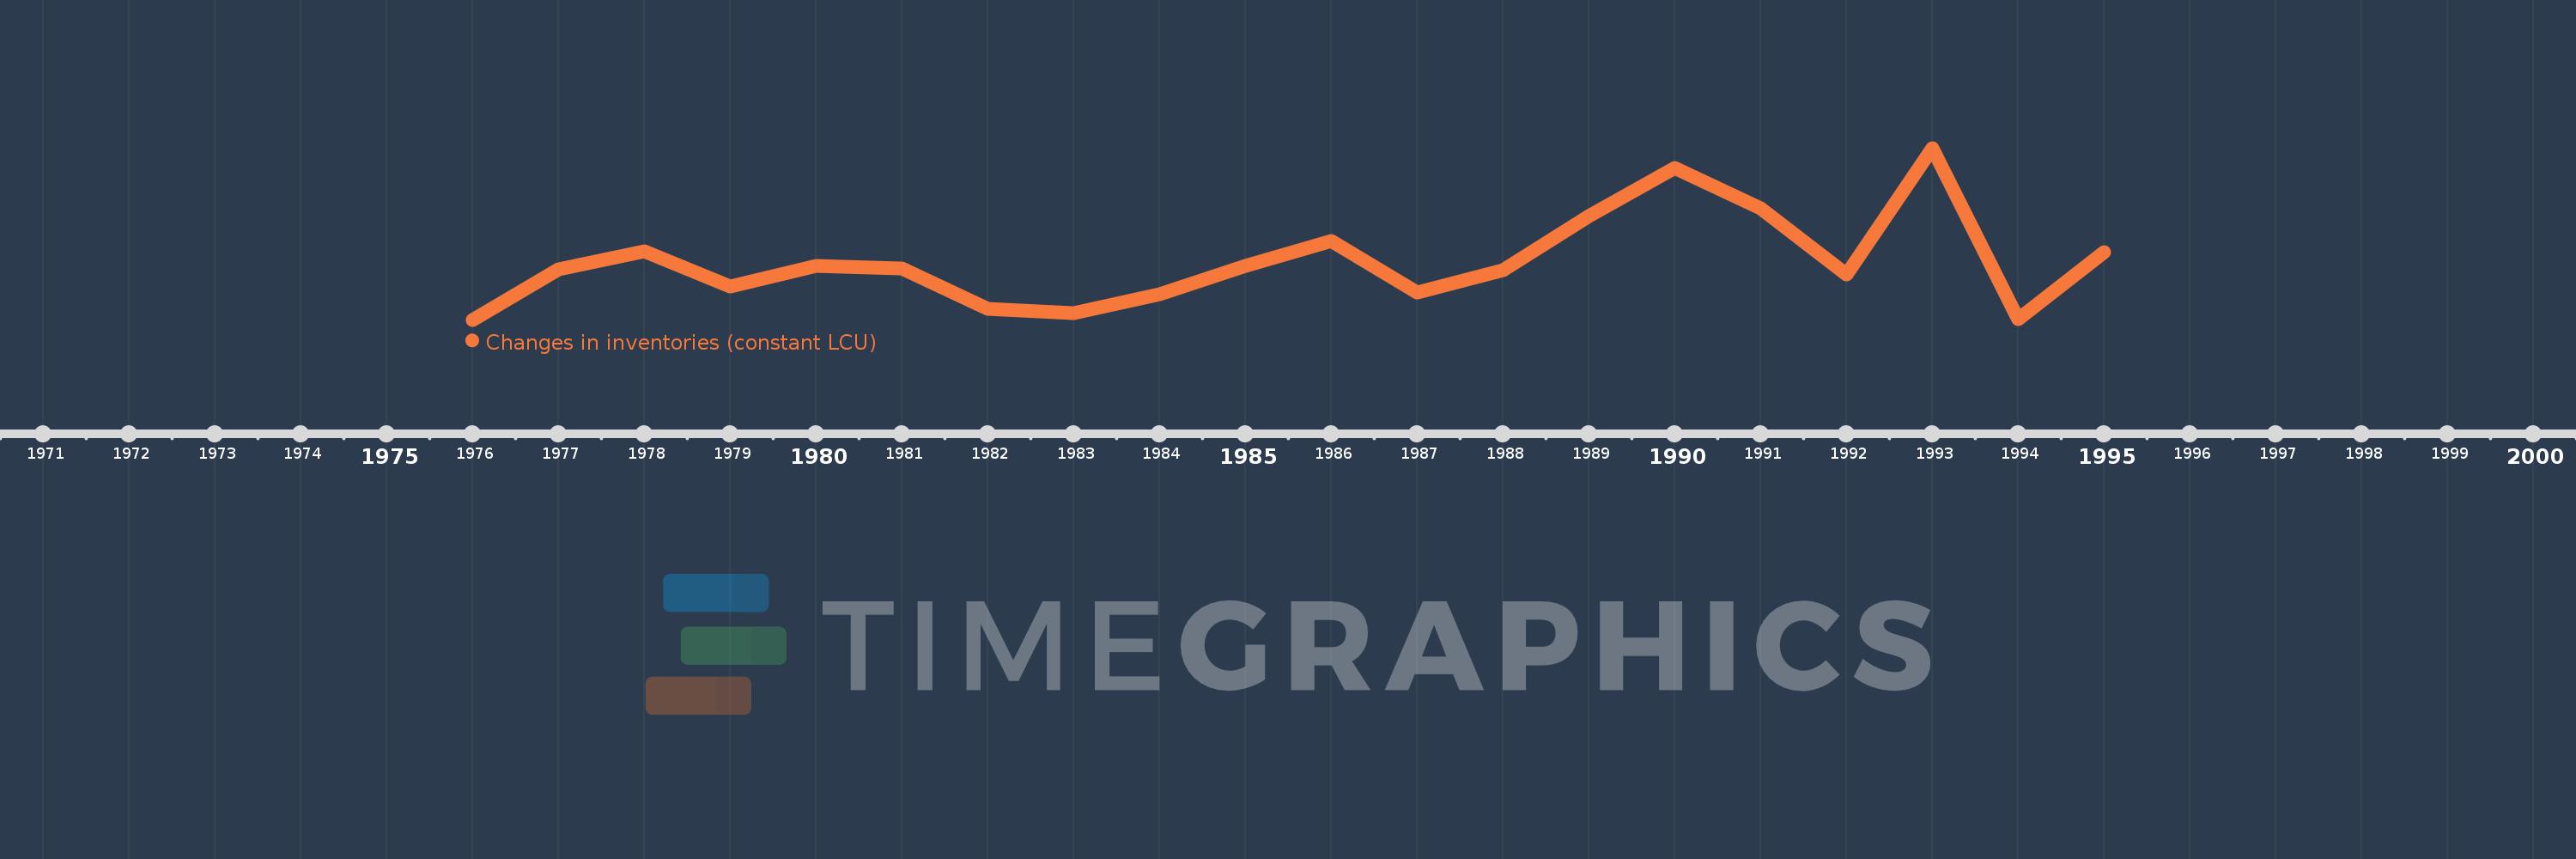
Changes in inventories (constant LCU)
1995,1994,1993,1992,1991,1990,1989,1988,1987,1986,1985,1984,1983,1982,1981,1980,1979,1978,1977,1976
This statistics in other country:
AlbaniaAlgeriaAngolaArgentinaArmeniaAustraliaAustriaAzerbaijanBahamas, TheBahrainBarbadosBelarusBelgiumBelizeBeninBhutanBoliviaBosnia and HerzegovinaBotswanaBrazilBrunei DarussalamBurkina FasoBurundiCabo VerdeCambodiaCameroonCanadaCentral African RepublicChadChileChinaColombiaComorosCongo, Dem. Rep.Congo, Rep.Cote d'IvoireCroatiaCubaCyprusCzech RepublicDenmarkDjiboutiDominican RepublicEcuadorEgypt, Arab Rep.El SalvadorEquatorial GuineaEritreaEstoniaFinlandFranceGabonGambia, TheGeorgiaGermanyGhanaGreeceGuatemalaGuineaGuinea-BissauHondurasHong Kong SAR, ChinaHungaryIcelandIndiaIndonesiaIran, Islamic Rep.IrelandItalyJamaicaJapanJordanKazakhstanKenyaKorea, Rep.KosovoKyrgyz RepublicLao PDRLatviaLebanonLiberiaLithuaniaLuxembourgMacao SAR, ChinaMacedonia, FYRMadagascarMalawiMalaysiaMaldivesMaliMauritaniaMauritiusMexicoMoldovaMongoliaMontenegroMoroccoMozambiqueNamibiaNepalNetherlandsNew ZealandNicaraguaNigerNigeriaNorwayOmanPakistanPanamaPapua New GuineaParaguayPeruPhilippinesPolandPortugalPuerto RicoRomaniaRussian FederationRwandaSaudi ArabiaSenegalSerbiaSeychellesSierra LeoneSingaporeSlovak RepublicSloveniaSomaliaSouth AfricaSouth SudanSpainSri LankaSudanSwazilandSwedenSwitzerlandSyrian Arab RepublicTajikistanTanzaniaThailandTimor-LesteTogoTrinidad and TobagoTunisiaTurkeyUgandaUkraineUnited Arab EmiratesUnited KingdomUnited StatesUruguayVanuatuVenezuela, RBVietnamWest Bank and GazaZambiaZimbabwe Timeline:
This timeline shows a graph from 1976 to 1995 of Cyprus. No data until 1975. Number of actual observations by date: 20.
Source name:
World Development Indicators
Source organization:
World Bank national accounts data, and OECD National Accounts data files.
Categories, topics:
Economy & Growth
Last updated:
apr 23, 2017
Indicators value changes by year
Minimum:
215.478 mln
jan 1, 1976
Maximum:
778.958 mln
jan 1, 1993
At the date of observation
Value
Absolute change
Change from previous value
jan 1, 1976
215.478 mln
+215.478 mln
0.0%
jan 1, 1977
381.386 mln
+165.908 mln
77.0%
jan 1, 1978
440.061 mln
+58.675 mln
15.38%
jan 1, 1979
325.746 mln
-114.314 mln
-25.98%
jan 1, 1980
392.514 mln
+66.768 mln
20.5%
jan 1, 1981
383.409 mln
-9.105 mln
-2.32%
jan 1, 1982
249.874 mln
-133.536 mln
-34.83%
jan 1, 1983
236.722 mln
-13.151 mln
-5.26%
jan 1, 1984
298.432 mln
+61.71 mln
26.07%
jan 1, 1985
392.514 mln
+94.082 mln
31.53%
jan 1, 1986
472.433 mln
+79.919 mln
20.36%
jan 1, 1987
303.49 mln
-168.943 mln
-35.76%
jan 1, 1988
378.351 mln
+74.861 mln
24.67%
jan 1, 1989
554.375 mln
+176.024 mln
46.52%
jan 1, 1990
714.213 mln
+159.838 mln
28.83%
jan 1, 1991
579.666 mln
-134.547 mln
-18.84%
jan 1, 1992
365.2 mln
-214.466 mln
-37.0%
jan 1, 1993
778.958 mln
+413.758 mln
113.3%
jan 1, 1994
216.49 mln
-562.468 mln
-72.21%
jan 1, 1995
437.026 mln
+220.536 mln
101.87%
Ranking of countries by current statistics by years


Comments: