29
/
en
AIzaSyAYiBZKx7MnpbEhh9jyipgxe19OcubqV5w
April 1, 2024
146610
Guinea-Bissau
GNB
true
2
1
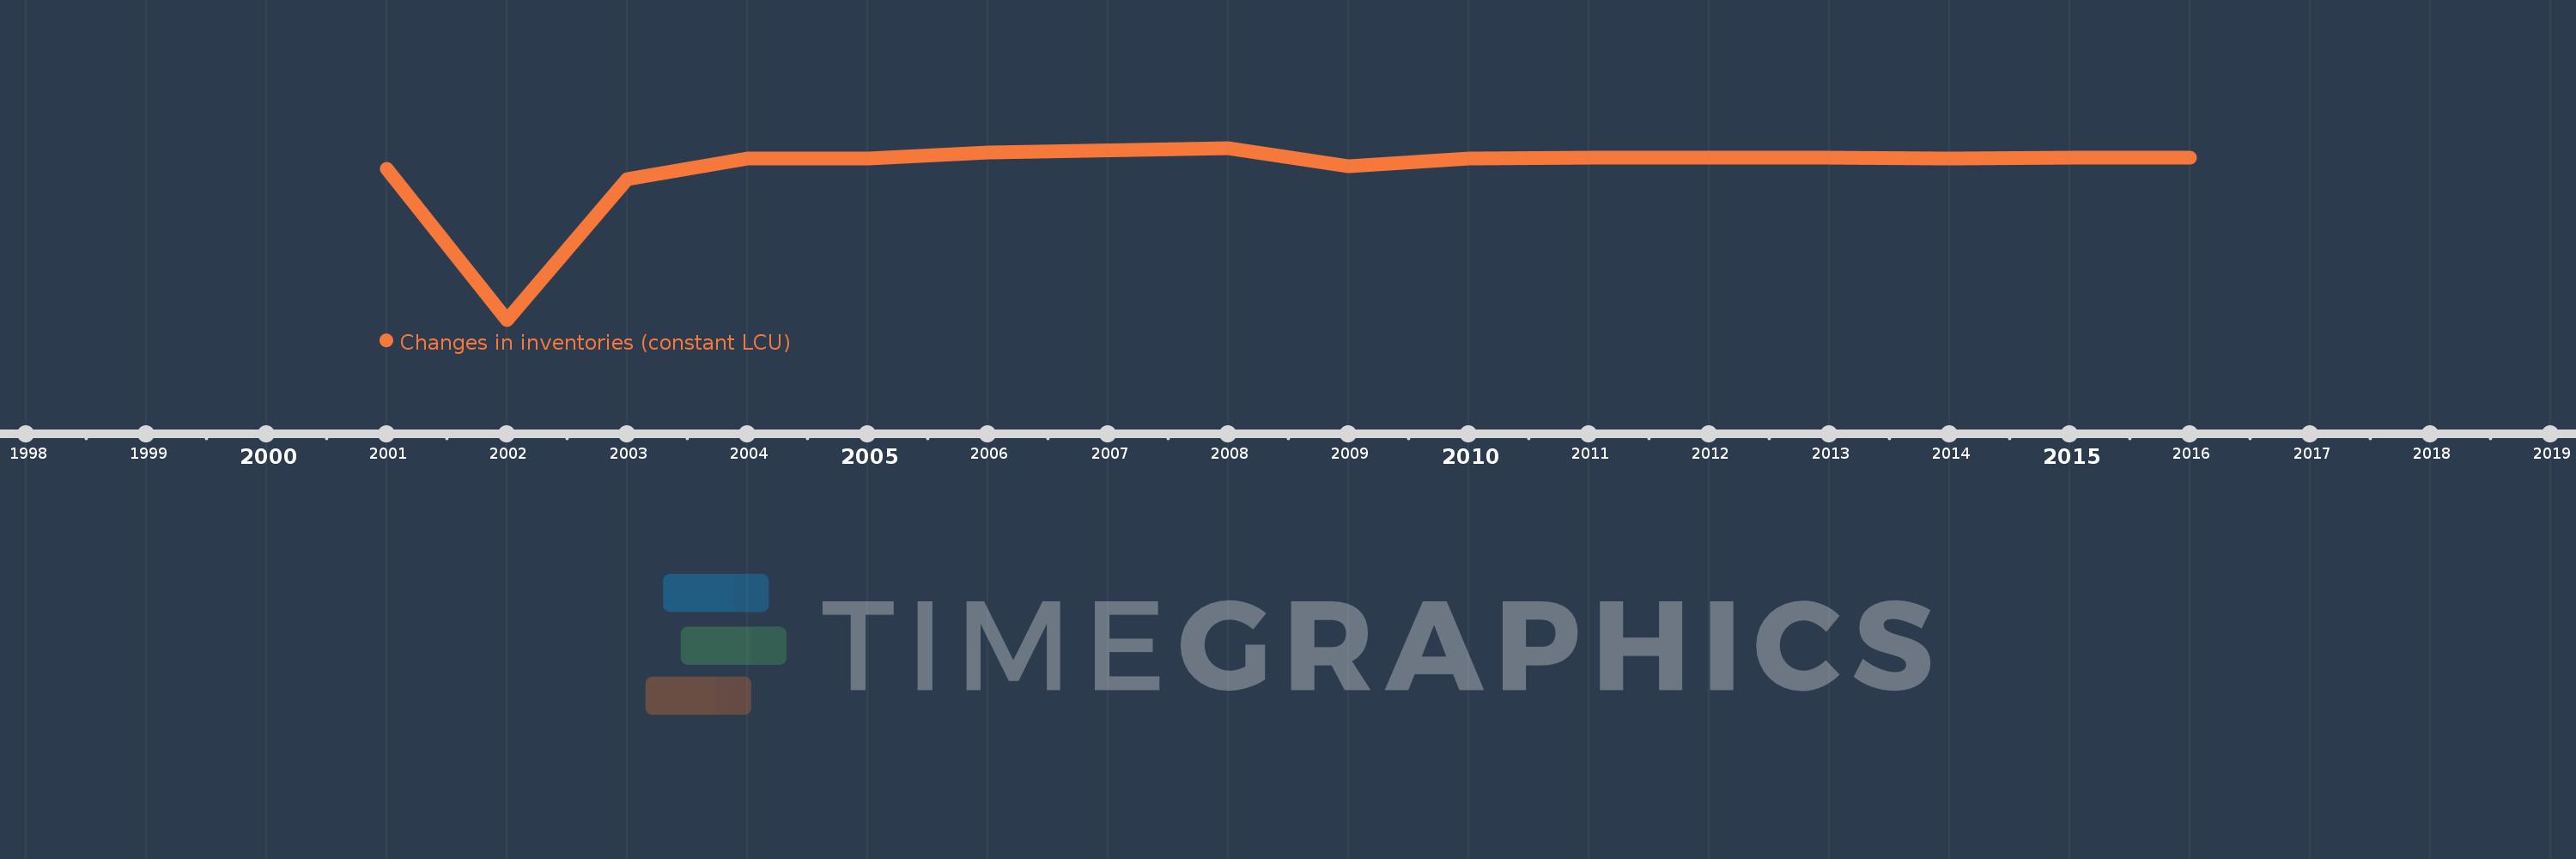
Changes in inventories (constant LCU)
2016,2015,2014,2013,2012,2011,2010,2009,2008,2006,2005,2004,2003,2002,2001
This statistics in other country:
AlbaniaAlgeriaAngolaArgentinaArmeniaAustraliaAustriaAzerbaijanBahamas, TheBahrainBarbadosBelarusBelgiumBelizeBeninBhutanBoliviaBosnia and HerzegovinaBotswanaBrazilBrunei DarussalamBurkina FasoBurundiCabo VerdeCambodiaCameroonCanadaCentral African RepublicChadChileChinaColombiaComorosCongo, Dem. Rep.Congo, Rep.Cote d'IvoireCroatiaCubaCyprusCzech RepublicDenmarkDjiboutiDominican RepublicEcuadorEgypt, Arab Rep.El SalvadorEquatorial GuineaEritreaEstoniaFinlandFranceGabonGambia, TheGeorgiaGermanyGhanaGreeceGuatemalaGuineaGuinea-BissauHondurasHong Kong SAR, ChinaHungaryIcelandIndiaIndonesiaIran, Islamic Rep.IrelandItalyJamaicaJapanJordanKazakhstanKenyaKorea, Rep.KosovoKyrgyz RepublicLao PDRLatviaLebanonLiberiaLithuaniaLuxembourgMacao SAR, ChinaMacedonia, FYRMadagascarMalawiMalaysiaMaldivesMaliMauritaniaMauritiusMexicoMoldovaMongoliaMontenegroMoroccoMozambiqueNamibiaNepalNetherlandsNew ZealandNicaraguaNigerNigeriaNorwayOmanPakistanPanamaPapua New GuineaParaguayPeruPhilippinesPolandPortugalPuerto RicoRomaniaRussian FederationRwandaSaudi ArabiaSenegalSerbiaSeychellesSierra LeoneSingaporeSlovak RepublicSloveniaSomaliaSouth AfricaSouth SudanSpainSri LankaSudanSwazilandSwedenSwitzerlandSyrian Arab RepublicTajikistanTanzaniaThailandTimor-LesteTogoTrinidad and TobagoTunisiaTurkeyUgandaUkraineUnited Arab EmiratesUnited KingdomUnited StatesUruguayVanuatuVenezuela, RBVietnamWest Bank and GazaZambiaZimbabwe Timeline:
This timeline shows a graph from 2001 to 2016 of Guinea-Bissau. No data until 2000. Number of actual observations by date: 15.
Source name:
World Development Indicators
Source organization:
World Bank national accounts data, and OECD National Accounts data files.
Categories, topics:
Economy & Growth
Last updated:
apr 23, 2017
Indicators value changes by year
Minimum:
-21.939 bln
jan 1, 2002
Maximum:
1.763 bln
jan 1, 2008
At the date of observation
Value
Absolute change
Change from previous value
jan 1, 2001
-1.067 bln
-1.067 bln
0.0%
jan 1, 2002
-21.939 bln
-20.872 bln
1.96K%
jan 1, 2003
-2.581 bln
+19.358 bln
-88.24%
jan 1, 2004
307.353 mln
+2.888 bln
-111.91%
jan 1, 2005
302.678 mln
-4.675 mln
-1.52%
jan 1, 2006
1.093 bln
+790.718 mln
261.24%
jan 1, 2008
1.763 bln
+669.604 mln
61.24%
jan 1, 2009
-783.0 mln
-2.546 bln
-144.41%
jan 1, 2010
357.0 mln
+1.14 bln
-145.59%
jan 1, 2011
366.0 mln
+9.0 mln
2.52%
jan 1, 2012
374.0 mln
+8.0 mln
2.19%
jan 1, 2013
374.0 mln
0.0
0.0%
jan 1, 2014
363.472 mln
-10.528 mln
-2.82%
jan 1, 2015
372.709 mln
+9.237 mln
2.54%
jan 1, 2016
379.27 mln
+6.561 mln
1.76%
Ranking of countries by current statistics by years


Comments: