29
/
en
AIzaSyAYiBZKx7MnpbEhh9jyipgxe19OcubqV5w
April 1, 2024
279550
Vanuatu
VUT
true
2
1
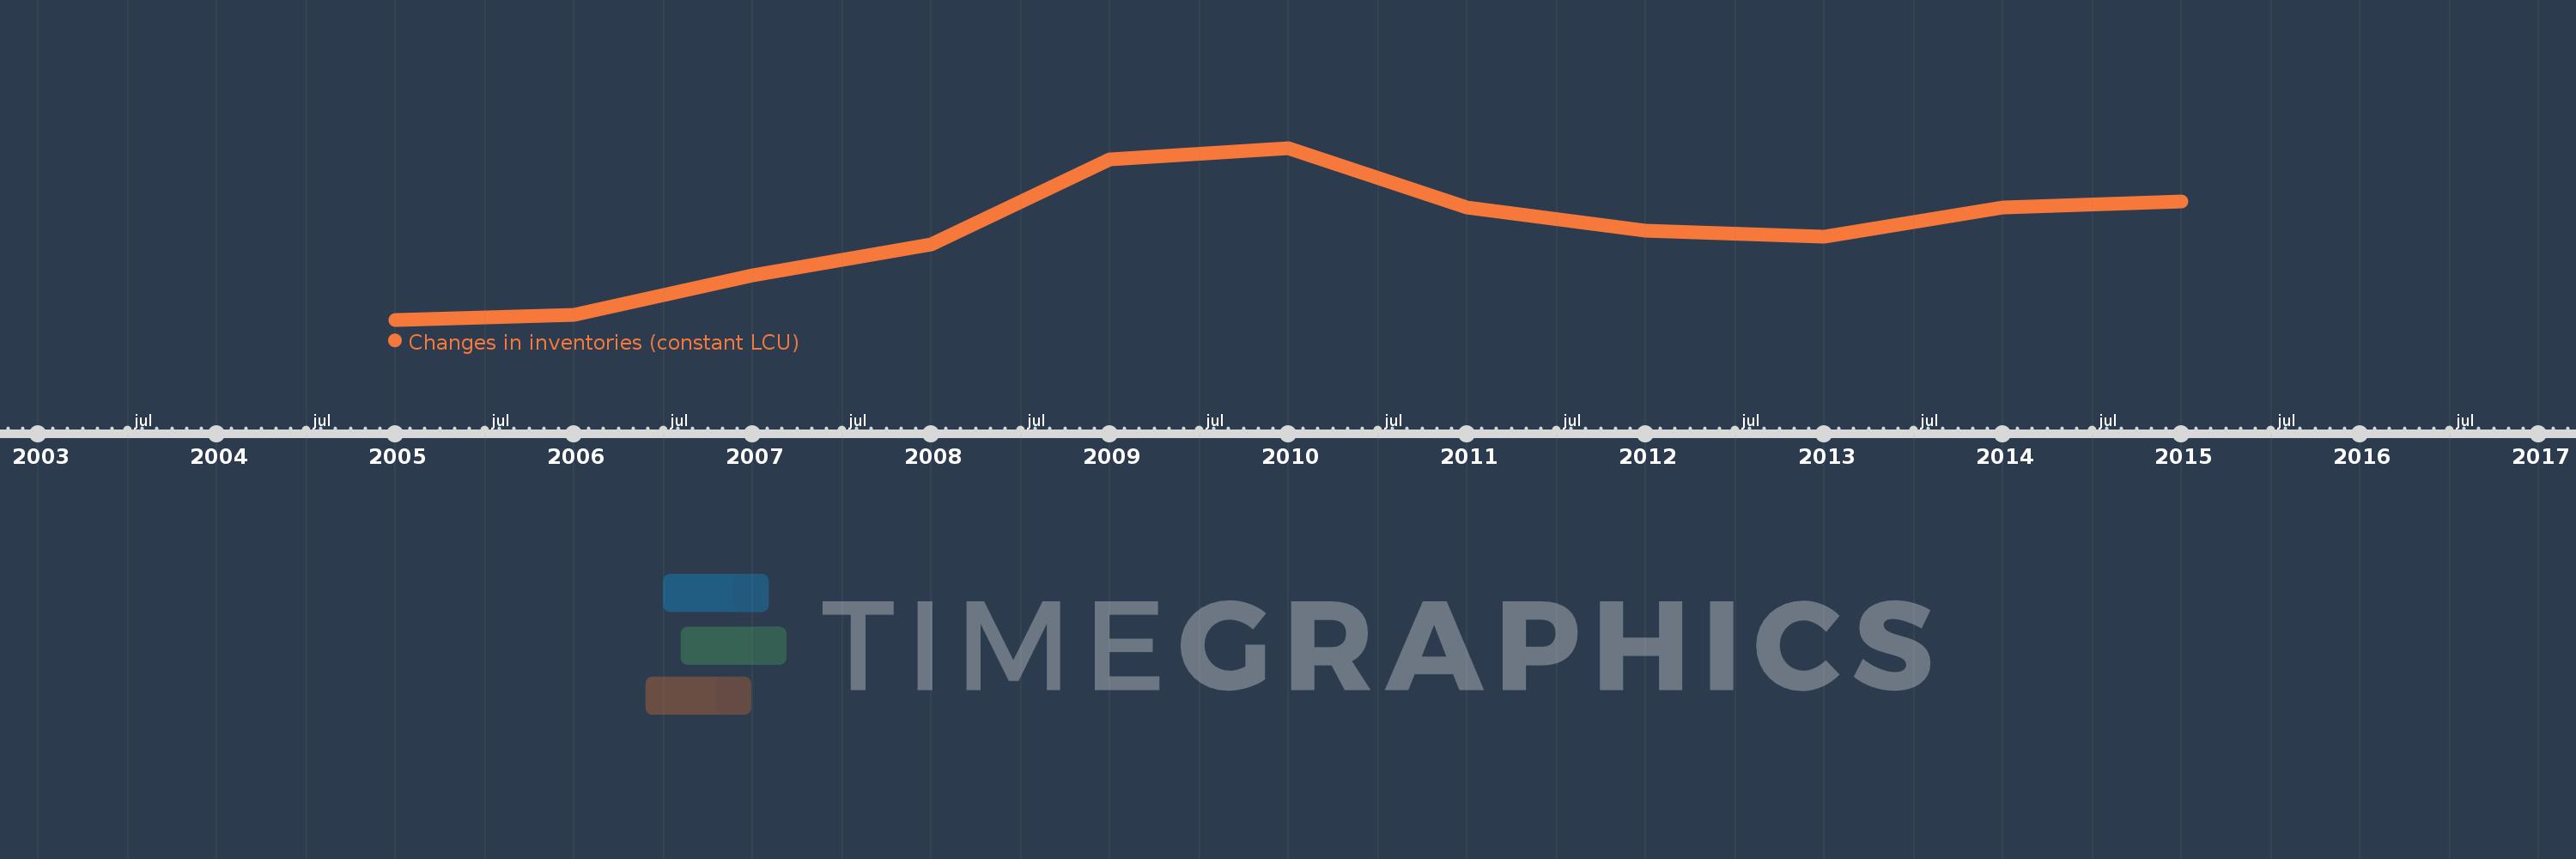
Changes in inventories (constant LCU)
2015,2014,2013,2012,2011,2010,2009,2008,2007,2006,2005
This statistics in other country:
AlbaniaAlgeriaAngolaArgentinaArmeniaAustraliaAustriaAzerbaijanBahamas, TheBahrainBarbadosBelarusBelgiumBelizeBeninBhutanBoliviaBosnia and HerzegovinaBotswanaBrazilBrunei DarussalamBurkina FasoBurundiCabo VerdeCambodiaCameroonCanadaCentral African RepublicChadChileChinaColombiaComorosCongo, Dem. Rep.Congo, Rep.Cote d'IvoireCroatiaCubaCyprusCzech RepublicDenmarkDjiboutiDominican RepublicEcuadorEgypt, Arab Rep.El SalvadorEquatorial GuineaEritreaEstoniaFinlandFranceGabonGambia, TheGeorgiaGermanyGhanaGreeceGuatemalaGuineaGuinea-BissauHondurasHong Kong SAR, ChinaHungaryIcelandIndiaIndonesiaIran, Islamic Rep.IrelandItalyJamaicaJapanJordanKazakhstanKenyaKorea, Rep.KosovoKyrgyz RepublicLao PDRLatviaLebanonLiberiaLithuaniaLuxembourgMacao SAR, ChinaMacedonia, FYRMadagascarMalawiMalaysiaMaldivesMaliMauritaniaMauritiusMexicoMoldovaMongoliaMontenegroMoroccoMozambiqueNamibiaNepalNetherlandsNew ZealandNicaraguaNigerNigeriaNorwayOmanPakistanPanamaPapua New GuineaParaguayPeruPhilippinesPolandPortugalPuerto RicoRomaniaRussian FederationRwandaSaudi ArabiaSenegalSerbiaSeychellesSierra LeoneSingaporeSlovak RepublicSloveniaSomaliaSouth AfricaSouth SudanSpainSri LankaSudanSwazilandSwedenSwitzerlandSyrian Arab RepublicTajikistanTanzaniaThailandTimor-LesteTogoTrinidad and TobagoTunisiaTurkeyUgandaUkraineUnited Arab EmiratesUnited KingdomUnited StatesUruguayVanuatuVenezuela, RBVietnamWest Bank and GazaZambiaZimbabwe Timeline:
This timeline shows a graph from 2005 to 2015 of Vanuatu. No data until 2004. Number of actual observations by date: 11.
Source name:
World Development Indicators
Source organization:
World Bank national accounts data, and OECD National Accounts data files.
Categories, topics:
Economy & Growth
Last updated:
apr 23, 2017
Indicators value changes by year
Minimum:
294.0 mln
jan 1, 2005
Maximum:
770.0 mln
jan 1, 2010
At the date of observation
Value
Absolute change
Change from previous value
jan 1, 2005
294.0 mln
+294.0 mln
0.0%
jan 1, 2006
308.0 mln
+14.0 mln
4.76%
jan 1, 2007
417.0 mln
+109.0 mln
35.39%
jan 1, 2008
502.0 mln
+85.0 mln
20.38%
jan 1, 2009
739.0 mln
+237.0 mln
47.21%
jan 1, 2010
770.0 mln
+31.0 mln
4.19%
jan 1, 2011
605.0 mln
-165.0 mln
-21.43%
jan 1, 2012
540.0 mln
-65.0 mln
-10.74%
jan 1, 2013
523.0 mln
-17.0 mln
-3.15%
jan 1, 2014
606.0 mln
+83.0 mln
15.87%
jan 1, 2015
621.0 mln
+15.0 mln
2.48%
Ranking of countries by current statistics by years


Comments: