29
/
en
AIzaSyAYiBZKx7MnpbEhh9jyipgxe19OcubqV5w
April 1, 2024
175094
Latvia
LVA
true
2
1
Changes in inventories (constant LCU)
2015,2014,2013,2012,2011,2010,2009,2008,2007,2006,2005,2004,2003,2002,2001,2000,1999,1998,1997,1996
This statistics in other country:
AlbaniaAlgeriaAngolaArgentinaArmeniaAustraliaAustriaAzerbaijanBahamas, TheBahrainBarbadosBelarusBelgiumBelizeBeninBhutanBoliviaBosnia and HerzegovinaBotswanaBrazilBrunei DarussalamBurkina FasoBurundiCabo VerdeCambodiaCameroonCanadaCentral African RepublicChadChileChinaColombiaComorosCongo, Dem. Rep.Congo, Rep.Cote d'IvoireCroatiaCubaCyprusCzech RepublicDenmarkDjiboutiDominican RepublicEcuadorEgypt, Arab Rep.El SalvadorEquatorial GuineaEritreaEstoniaFinlandFranceGabonGambia, TheGeorgiaGermanyGhanaGreeceGuatemalaGuineaGuinea-BissauHondurasHong Kong SAR, ChinaHungaryIcelandIndiaIndonesiaIran, Islamic Rep.IrelandItalyJamaicaJapanJordanKazakhstanKenyaKorea, Rep.KosovoKyrgyz RepublicLao PDRLatviaLebanonLiberiaLithuaniaLuxembourgMacao SAR, ChinaMacedonia, FYRMadagascarMalawiMalaysiaMaldivesMaliMauritaniaMauritiusMexicoMoldovaMongoliaMontenegroMoroccoMozambiqueNamibiaNepalNetherlandsNew ZealandNicaraguaNigerNigeriaNorwayOmanPakistanPanamaPapua New GuineaParaguayPeruPhilippinesPolandPortugalPuerto RicoRomaniaRussian FederationRwandaSaudi ArabiaSenegalSerbiaSeychellesSierra LeoneSingaporeSlovak RepublicSloveniaSomaliaSouth AfricaSouth SudanSpainSri LankaSudanSwazilandSwedenSwitzerlandSyrian Arab RepublicTajikistanTanzaniaThailandTimor-LesteTogoTrinidad and TobagoTunisiaTurkeyUgandaUkraineUnited Arab EmiratesUnited KingdomUnited StatesUruguayVanuatuVenezuela, RBVietnamWest Bank and GazaZambiaZimbabwe Timeline:
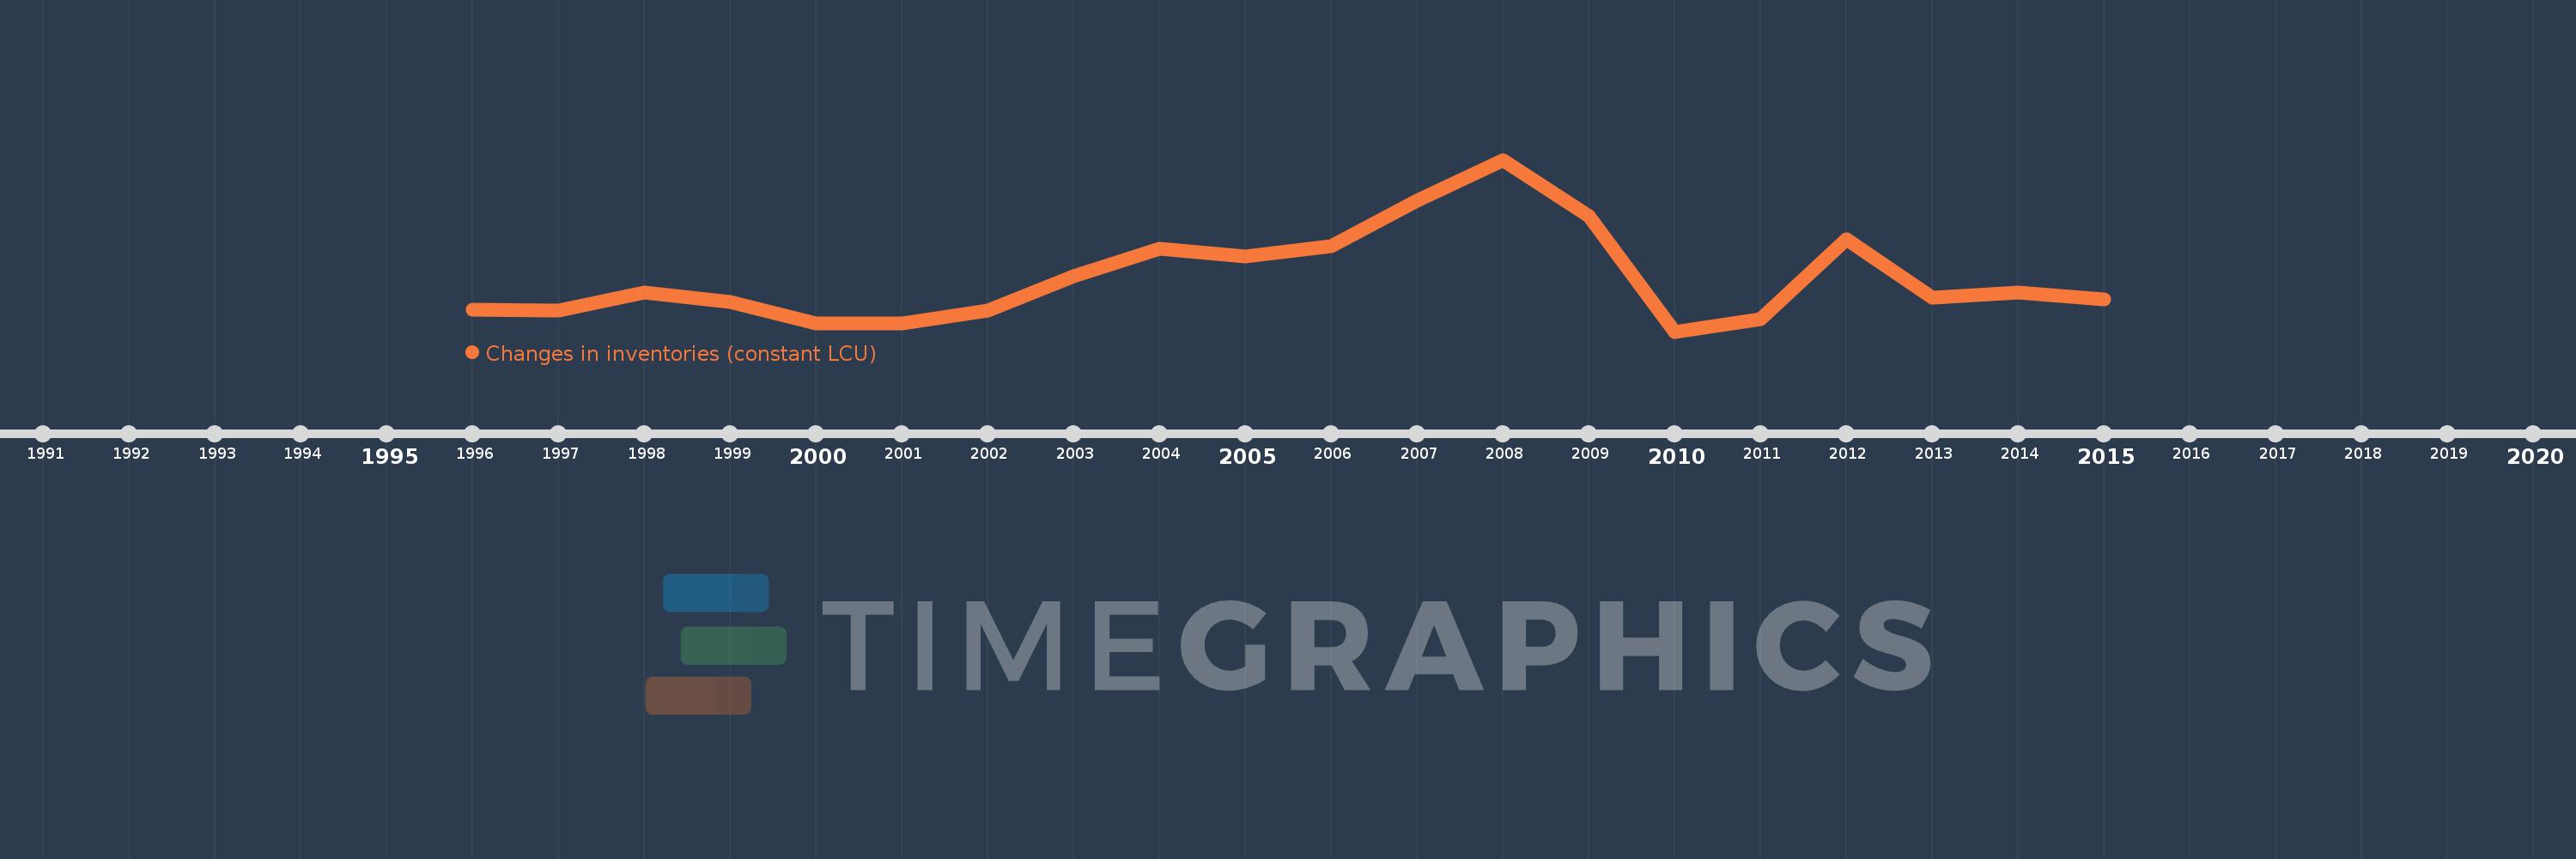
This timeline shows a graph from 1996 to 2015 of Latvia. No data until 1995. Number of actual observations by date: 20.
Source name:
World Development Indicators
Source organization:
World Bank national accounts data, and OECD National Accounts data files.
Categories, topics:
Economy & Growth
Last updated:
apr 23, 2017
Indicators value changes by year
Minimum:
-90.601 mln
jan 1, 2010
Maximum:
1.172 bln
jan 1, 2008
At the date of observation
Value
Absolute change
Change from previous value
jan 1, 1996
67.411 mln
+67.411 mln
0.0%
jan 1, 1997
61.806 mln
-5.605 mln
-8.31%
jan 1, 1998
197.775 mln
+135.969 mln
219.99%
jan 1, 1999
129.504 mln
-68.271 mln
-34.52%
jan 1, 2000
-31.266 mln
-160.77 mln
-124.14%
jan 1, 2001
-30.359 mln
+907.0K
-2.9%
jan 1, 2002
65.073 mln
+95.432 mln
-314.35%
jan 1, 2003
314.796 mln
+249.723 mln
383.76%
jan 1, 2004
519.593 mln
+204.797 mln
65.06%
jan 1, 2005
464.477 mln
-55.116 mln
-10.61%
jan 1, 2006
539.894 mln
+75.417 mln
16.24%
jan 1, 2007
874.135 mln
+334.241 mln
61.91%
jan 1, 2008
1.172 bln
+297.702 mln
34.06%
jan 1, 2009
757.741 mln
-414.096 mln
-35.34%
jan 1, 2010
-90.601 mln
-848.342 mln
-111.96%
jan 1, 2011
4.036 mln
+94.637 mln
-104.45%
jan 1, 2012
590.535 mln
+586.499 mln
14.53K%
jan 1, 2013
158.845 mln
-431.69 mln
-73.1%
jan 1, 2014
199.153 mln
+40.308 mln
25.38%
jan 1, 2015
143.444 mln
-55.709 mln
-27.97%
Ranking of countries by current statistics by years


Comments: