29
/
en
AIzaSyAYiBZKx7MnpbEhh9jyipgxe19OcubqV5w
April 1, 2024
214090
Norway
NOR
true
2
1
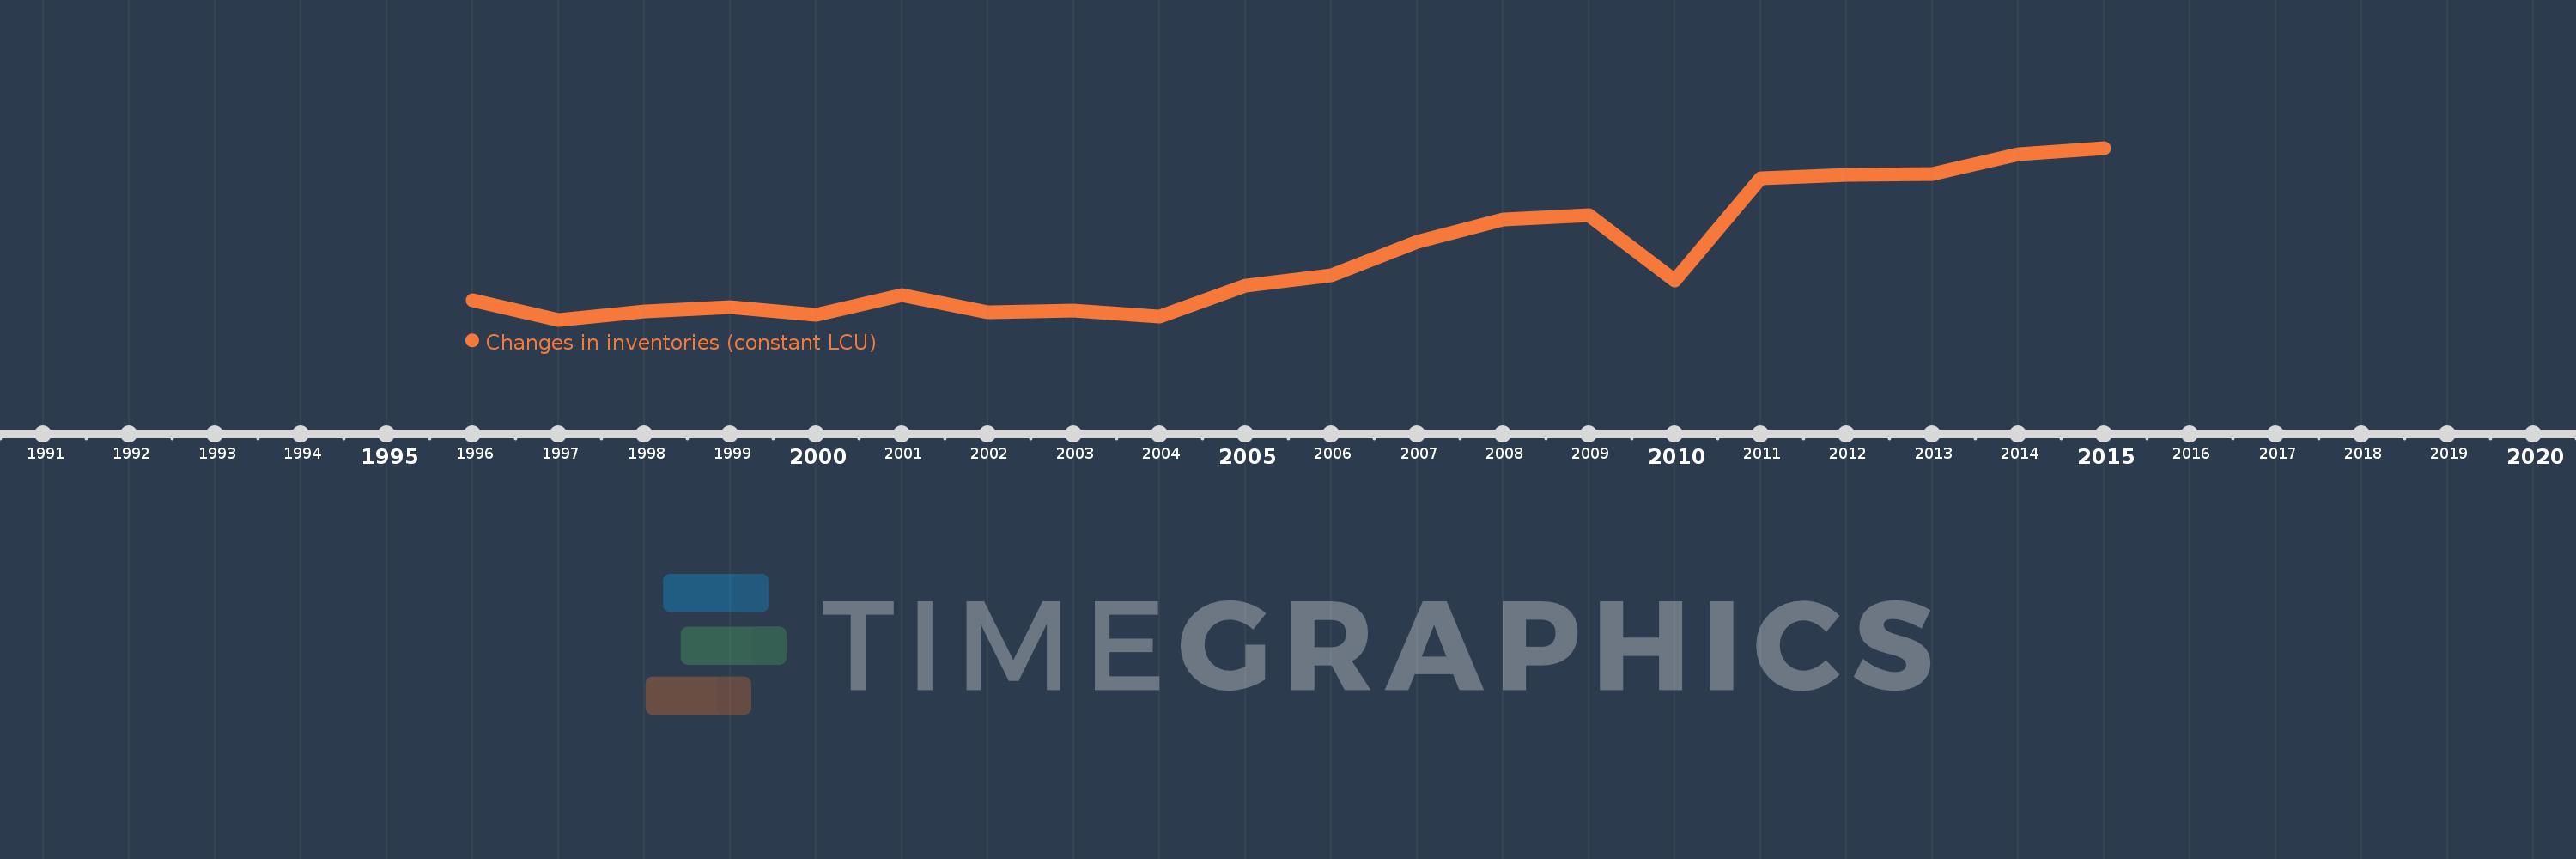
Changes in inventories (constant LCU)
2015,2014,2013,2012,2011,2010,2009,2008,2007,2006,2005,2004,2003,2002,2001,2000,1999,1998,1997,1996
This statistics in other country:
AlbaniaAlgeriaAngolaArgentinaArmeniaAustraliaAustriaAzerbaijanBahamas, TheBahrainBarbadosBelarusBelgiumBelizeBeninBhutanBoliviaBosnia and HerzegovinaBotswanaBrazilBrunei DarussalamBurkina FasoBurundiCabo VerdeCambodiaCameroonCanadaCentral African RepublicChadChileChinaColombiaComorosCongo, Dem. Rep.Congo, Rep.Cote d'IvoireCroatiaCubaCyprusCzech RepublicDenmarkDjiboutiDominican RepublicEcuadorEgypt, Arab Rep.El SalvadorEquatorial GuineaEritreaEstoniaFinlandFranceGabonGambia, TheGeorgiaGermanyGhanaGreeceGuatemalaGuineaGuinea-BissauHondurasHong Kong SAR, ChinaHungaryIcelandIndiaIndonesiaIran, Islamic Rep.IrelandItalyJamaicaJapanJordanKazakhstanKenyaKorea, Rep.KosovoKyrgyz RepublicLao PDRLatviaLebanonLiberiaLithuaniaLuxembourgMacao SAR, ChinaMacedonia, FYRMadagascarMalawiMalaysiaMaldivesMaliMauritaniaMauritiusMexicoMoldovaMongoliaMontenegroMoroccoMozambiqueNamibiaNepalNetherlandsNew ZealandNicaraguaNigerNigeriaNorwayOmanPakistanPanamaPapua New GuineaParaguayPeruPhilippinesPolandPortugalPuerto RicoRomaniaRussian FederationRwandaSaudi ArabiaSenegalSerbiaSeychellesSierra LeoneSingaporeSlovak RepublicSloveniaSomaliaSouth AfricaSouth SudanSpainSri LankaSudanSwazilandSwedenSwitzerlandSyrian Arab RepublicTajikistanTanzaniaThailandTimor-LesteTogoTrinidad and TobagoTunisiaTurkeyUgandaUkraineUnited Arab EmiratesUnited KingdomUnited StatesUruguayVanuatuVenezuela, RBVietnamWest Bank and GazaZambiaZimbabwe Timeline:
This timeline shows a graph from 1996 to 2015 of Norway. No data until 1995. Number of actual observations by date: 20.
Source name:
World Development Indicators
Source organization:
World Bank national accounts data, and OECD National Accounts data files.
Categories, topics:
Economy & Growth
Last updated:
apr 23, 2017
Indicators value changes by year
Minimum:
8.771 bln
jan 1, 1997
Maximum:
147.617 bln
jan 1, 2015
At the date of observation
Value
Absolute change
Change from previous value
jan 1, 1996
24.253 bln
+24.253 bln
0.0%
jan 1, 1997
8.771 bln
-15.482 bln
-63.84%
jan 1, 1998
15.613 bln
+6.842 bln
78.01%
jan 1, 1999
19.134 bln
+3.521 bln
22.55%
jan 1, 2000
12.458 bln
-6.676 bln
-34.89%
jan 1, 2001
28.974 bln
+16.516 bln
132.57%
jan 1, 2002
14.833 bln
-14.141 bln
-48.81%
jan 1, 2003
15.963 bln
+1.13 bln
7.62%
jan 1, 2004
11.459 bln
-4.504 bln
-28.22%
jan 1, 2005
36.562 bln
+25.103 bln
219.07%
jan 1, 2006
44.771 bln
+8.209 bln
22.45%
jan 1, 2007
71.731 bln
+26.96 bln
60.22%
jan 1, 2008
90.053 bln
+18.322 bln
25.54%
jan 1, 2009
92.929 bln
+2.876 bln
3.19%
jan 1, 2010
40.363 bln
-52.566 bln
-56.57%
jan 1, 2011
123.259 bln
+82.896 bln
205.38%
jan 1, 2012
125.798 bln
+2.539 bln
2.06%
jan 1, 2013
126.775 bln
+977.0 mln
0.78%
jan 1, 2014
142.585 bln
+15.81 bln
12.47%
jan 1, 2015
147.617 bln
+5.032 bln
3.53%
Ranking of countries by current statistics by years


Comments: