29
/
en
AIzaSyAYiBZKx7MnpbEhh9jyipgxe19OcubqV5w
April 1, 2024
283424
West Bank and Gaza
PSE
true
2
1
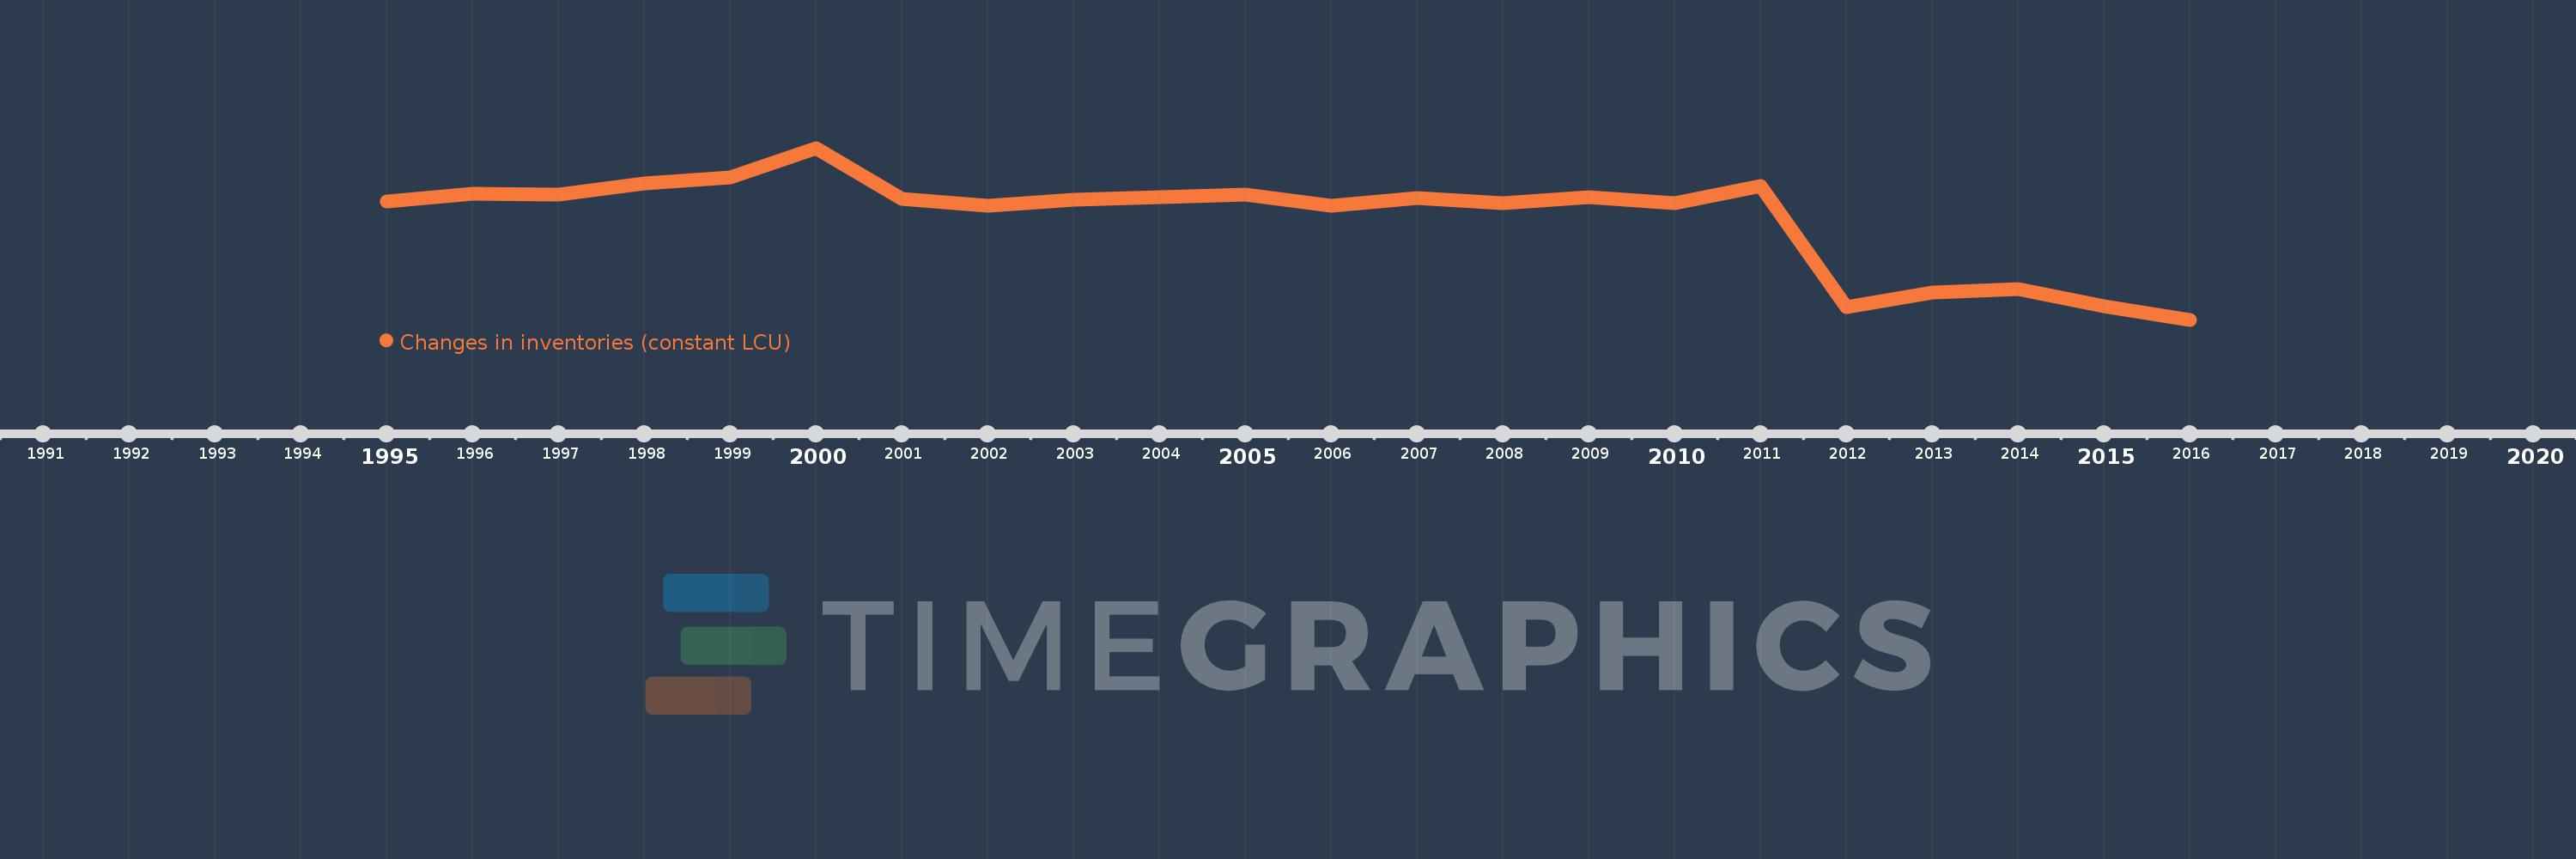
Changes in inventories (constant LCU)
2016,2015,2014,2013,2012,2011,2010,2009,2008,2007,2006,2005,2004,2003,2002,2001,2000,1999,1998,1997,1996,1995
This statistics in other country:
AlbaniaAlgeriaAngolaArgentinaArmeniaAustraliaAustriaAzerbaijanBahamas, TheBahrainBarbadosBelarusBelgiumBelizeBeninBhutanBoliviaBosnia and HerzegovinaBotswanaBrazilBrunei DarussalamBurkina FasoBurundiCabo VerdeCambodiaCameroonCanadaCentral African RepublicChadChileChinaColombiaComorosCongo, Dem. Rep.Congo, Rep.Cote d'IvoireCroatiaCubaCyprusCzech RepublicDenmarkDjiboutiDominican RepublicEcuadorEgypt, Arab Rep.El SalvadorEquatorial GuineaEritreaEstoniaFinlandFranceGabonGambia, TheGeorgiaGermanyGhanaGreeceGuatemalaGuineaGuinea-BissauHondurasHong Kong SAR, ChinaHungaryIcelandIndiaIndonesiaIran, Islamic Rep.IrelandItalyJamaicaJapanJordanKazakhstanKenyaKorea, Rep.KosovoKyrgyz RepublicLao PDRLatviaLebanonLiberiaLithuaniaLuxembourgMacao SAR, ChinaMacedonia, FYRMadagascarMalawiMalaysiaMaldivesMaliMauritaniaMauritiusMexicoMoldovaMongoliaMontenegroMoroccoMozambiqueNamibiaNepalNetherlandsNew ZealandNicaraguaNigerNigeriaNorwayOmanPakistanPanamaPapua New GuineaParaguayPeruPhilippinesPolandPortugalPuerto RicoRomaniaRussian FederationRwandaSaudi ArabiaSenegalSerbiaSeychellesSierra LeoneSingaporeSlovak RepublicSloveniaSomaliaSouth AfricaSouth SudanSpainSri LankaSudanSwazilandSwedenSwitzerlandSyrian Arab RepublicTajikistanTanzaniaThailandTimor-LesteTogoTrinidad and TobagoTunisiaTurkeyUgandaUkraineUnited Arab EmiratesUnited KingdomUnited StatesUruguayVanuatuVenezuela, RBVietnamWest Bank and GazaZambiaZimbabwe Timeline:
This timeline shows a graph from 1995 to 2016 of West Bank and Gaza. No data until 1994. Number of actual observations by date: 22.
Source name:
World Development Indicators
Source organization:
World Bank national accounts data, and OECD National Accounts data files.
Categories, topics:
Economy & Growth
Last updated:
apr 23, 2017
Indicators value changes by year
Minimum:
-930.889 mln
jan 1, 2016
Maximum:
596.117 mln
jan 1, 2000
At the date of observation
Value
Absolute change
Change from previous value
jan 1, 1995
123.455 mln
+123.455 mln
0.0%
jan 1, 1996
190.615 mln
+67.16 mln
54.4%
jan 1, 1997
183.842 mln
-6.773 mln
-3.55%
jan 1, 1998
281.151 mln
+97.309 mln
52.93%
jan 1, 1999
337.449 mln
+56.298 mln
20.02%
jan 1, 2000
596.117 mln
+258.668 mln
76.65%
jan 1, 2001
143.929 mln
-452.188 mln
-75.86%
jan 1, 2002
82.852 mln
-61.076 mln
-42.44%
jan 1, 2003
133.132 mln
+50.28 mln
60.69%
jan 1, 2004
156.065 mln
+22.933 mln
17.23%
jan 1, 2005
178.832 mln
+22.767 mln
14.59%
jan 1, 2006
79.881 mln
-98.951 mln
-55.33%
jan 1, 2007
150.161 mln
+70.279 mln
87.98%
jan 1, 2008
106.811 mln
-43.35 mln
-28.87%
jan 1, 2009
160.716 mln
+53.905 mln
50.47%
jan 1, 2010
105.986 mln
-54.73 mln
-34.05%
jan 1, 2011
258.489 mln
+152.503 mln
143.89%
jan 1, 2012
-815.807 mln
-1.074 bln
-415.61%
jan 1, 2013
-685.579 mln
+130.228 mln
-15.96%
jan 1, 2014
-659.332 mln
+26.247 mln
-3.83%
jan 1, 2015
-810.394 mln
-151.062 mln
22.91%
jan 1, 2016
-930.889 mln
-120.494 mln
14.87%
Ranking of countries by current statistics by years


Comments: