30
/
AIzaSyAYiBZKx7MnpbEhh9jyipgxe19OcubqV5w
April 1, 2024
200135
Montenegro
MNE
true
2
1
Changes in inventories (constant LCU)
2016,2015,2014,2013,2012,2011,2010,2009,2008,2001
Public Timelines
FAQ
Menu
Public Timelines
FAQ
Public Timelines
FAQ
For education
For educational institutions
For teachers
For students
Open cabinet
For educational institutions
For teachers
For students
Open cabinet
Create
Close
Create a timeline
Public timelines
Library
FAQ
Download
Global statistics library
→
Montenegro
→
Changes in inventories (constant LCU)
This statistics in other country:
Albania
Algeria
Angola
Argentina
Armenia
Australia
Austria
Azerbaijan
Bahamas, The
Bahrain
Barbados
Belarus
Belgium
Belize
Benin
Bhutan
Bolivia
Bosnia and Herzegovina
Botswana
Brazil
Brunei Darussalam
Burkina Faso
Burundi
Cabo Verde
Cambodia
Cameroon
Canada
Central African Republic
Chad
Chile
China
Colombia
Comoros
Congo, Dem. Rep.
Congo, Rep.
Cote d'Ivoire
Croatia
Cuba
Cyprus
Czech Republic
Denmark
Djibouti
Dominican Republic
Ecuador
Egypt, Arab Rep.
El Salvador
Equatorial Guinea
Eritrea
Estonia
Finland
France
Gabon
Gambia, The
Georgia
Germany
Ghana
Greece
Guatemala
Guinea
Guinea-Bissau
Honduras
Hong Kong SAR, China
Hungary
Iceland
India
Indonesia
Iran, Islamic Rep.
Ireland
Italy
Jamaica
Japan
Jordan
Kazakhstan
Kenya
Korea, Rep.
Kosovo
Kyrgyz Republic
Lao PDR
Latvia
Lebanon
Liberia
Lithuania
Luxembourg
Macao SAR, China
Macedonia, FYR
Madagascar
Malawi
Malaysia
Maldives
Mali
Mauritania
Mauritius
Mexico
Moldova
Mongolia
Montenegro
Morocco
Mozambique
Namibia
Nepal
Netherlands
New Zealand
Nicaragua
Niger
Nigeria
Norway
Oman
Pakistan
Panama
Papua New Guinea
Paraguay
Peru
Philippines
Poland
Portugal
Puerto Rico
Romania
Russian Federation
Rwanda
Saudi Arabia
Senegal
Serbia
Seychelles
Sierra Leone
Singapore
Slovak Republic
Slovenia
Somalia
South Africa
South Sudan
Spain
Sri Lanka
Sudan
Swaziland
Sweden
Switzerland
Syrian Arab Republic
Tajikistan
Tanzania
Thailand
Timor-Leste
Togo
Trinidad and Tobago
Tunisia
Turkey
Uganda
Ukraine
United Arab Emirates
United Kingdom
United States
Uruguay
Vanuatu
Venezuela, RB
Vietnam
West Bank and Gaza
Zambia
Zimbabwe
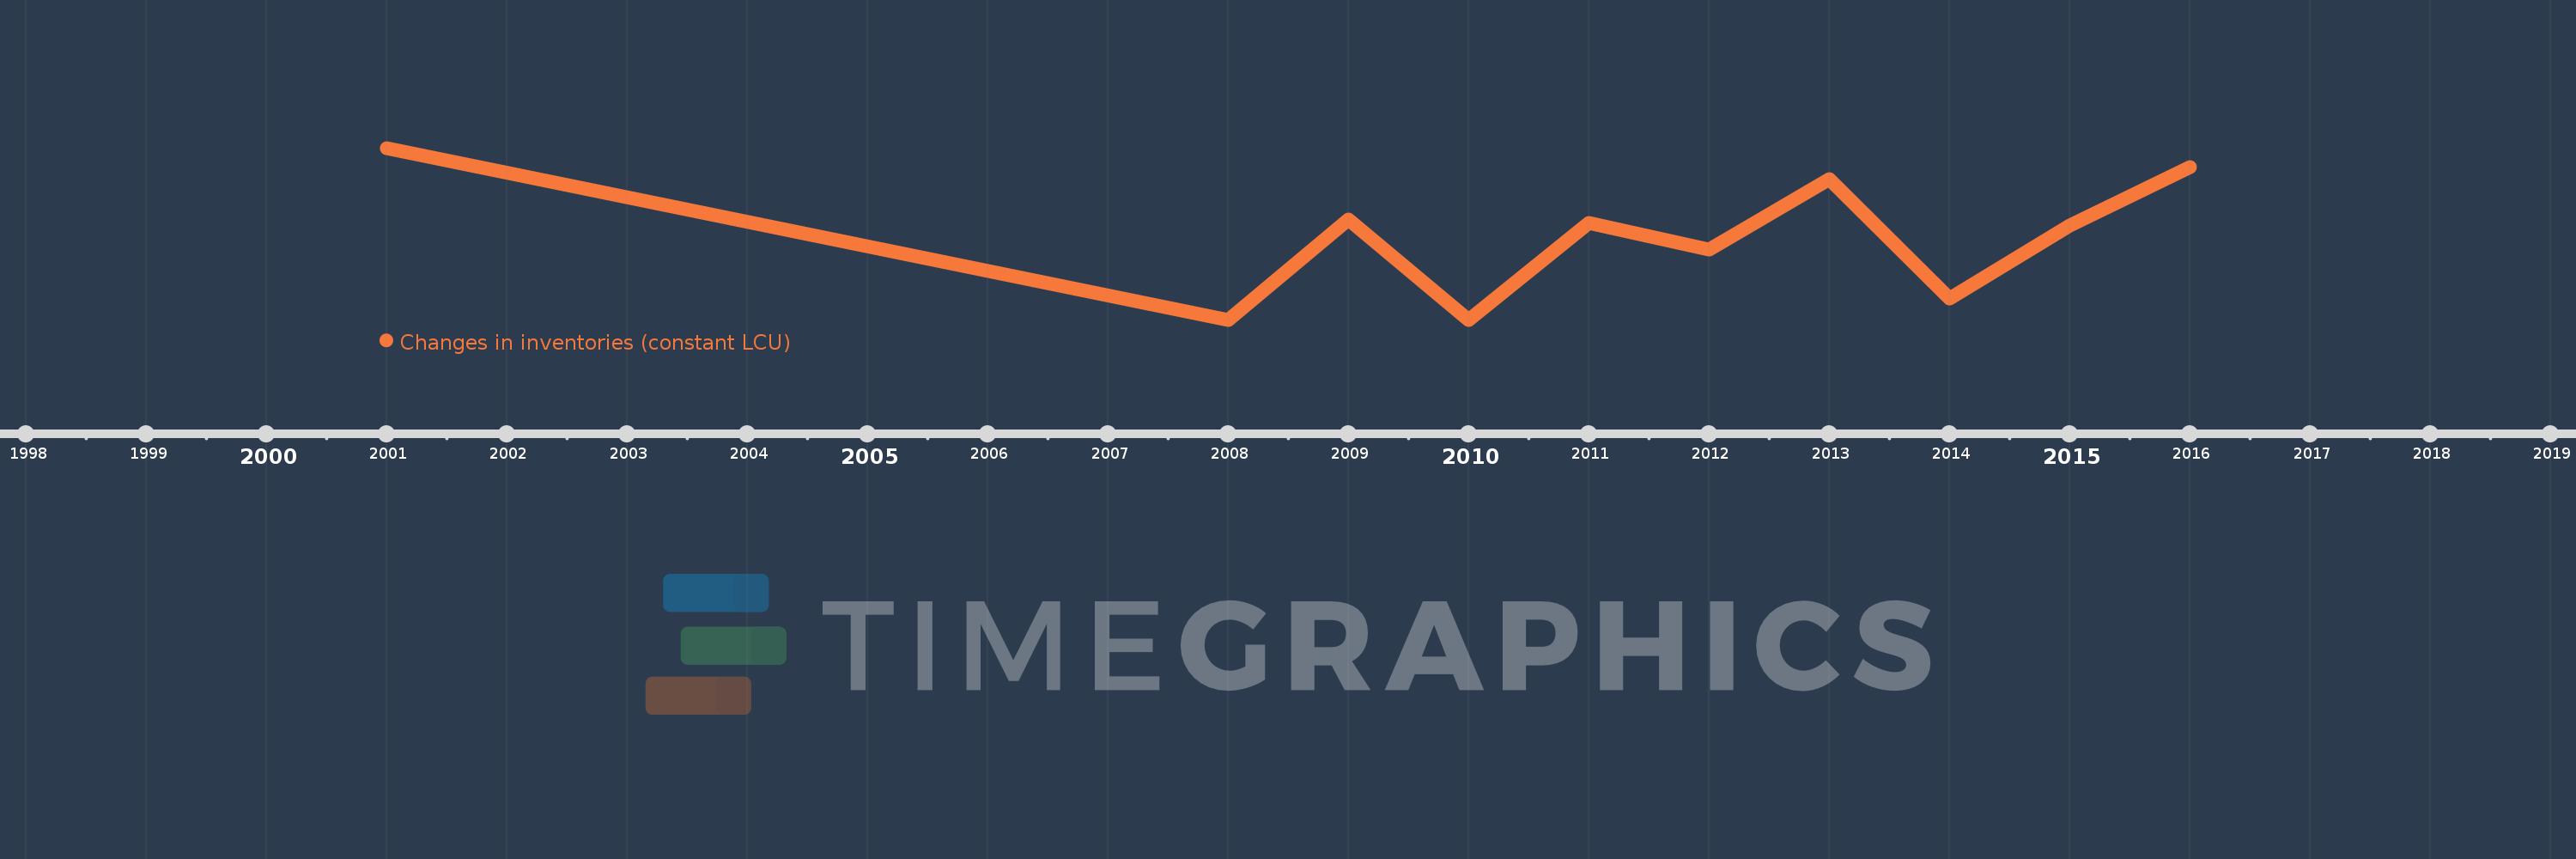
Timeline:
This timeline shows a graph from
2001
to
2016
of Montenegro. No data until
2000
. Number of actual observations by date:
10
.
Source name:
World Development Indicators
Source organization:
World Bank national accounts data, and OECD National Accounts data files.
Categories, topics:
Economy & Growth
Last updated:
apr 23, 2017
Indicators value changes by year
Meaning:
39.752 mln
Minimum:
21.234 mln
jan 1, 2008
Maximum:
58.772 mln
jan 1, 2001
At the date of observation
Value
Absolute change
Change from the previous value
jan 1, 2001
58.772 mln
+58.772 mln
0.0%
jan 1, 2008
21.234 mln
-37.538 mln
-63.87%
jan 1, 2009
43.178 mln
+21.945 mln
103.35%
jan 1, 2010
21.234 mln
-21.944 mln
-50.82%
jan 1, 2011
42.48 mln
+21.246 mln
100.06%
jan 1, 2012
36.543 mln
-5.937 mln
-13.98%
jan 1, 2013
51.969 mln
+15.426 mln
42.21%
jan 1, 2014
25.805 mln
-26.164 mln
-50.35%
jan 1, 2015
41.73 mln
+15.925 mln
61.71%
jan 1, 2016
54.572 mln
+12.843 mln
30.78%
Ranking of countries by current statistics by years
About & Feedback
Terms
Privacy
Library
2024
©
Time.Graphics
Support 24/7
Cabinet
Get premium
Donate
The service accepts bank transfer (ACH, Wire) or cards (Visa, MasterCard, etc). Processed by Stripe.
Secured with SSL
Excellent (Trustpilot Reviews)
Based on 115+ reviews
Write your own review on
Trustpilot.com
